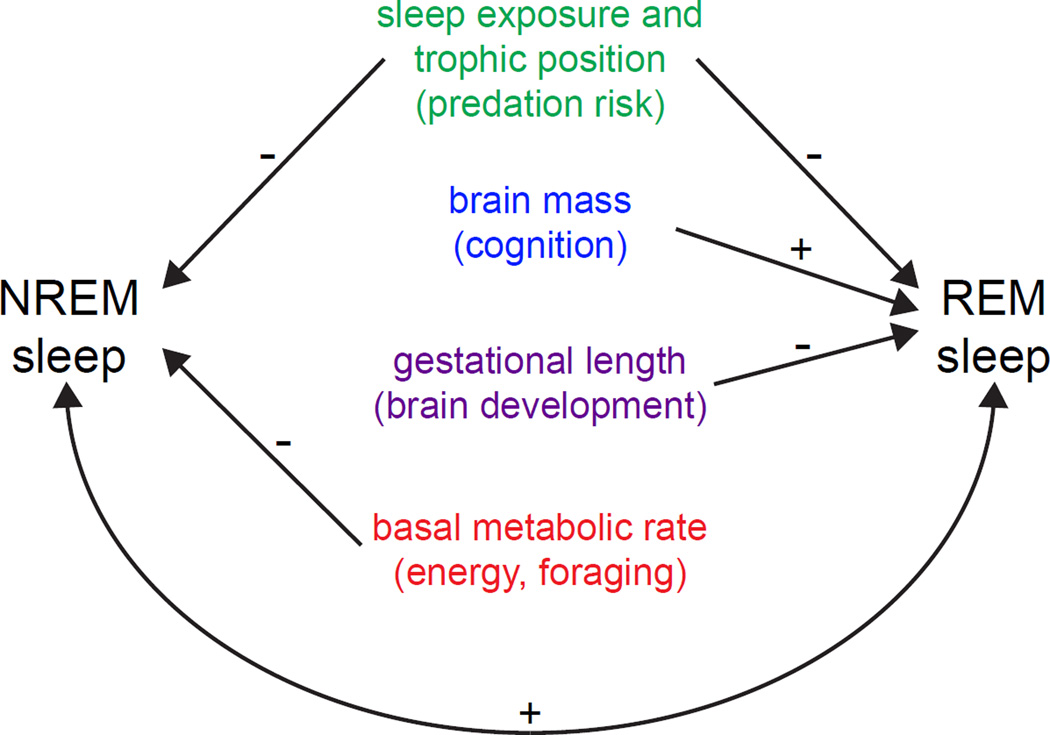
Figure 1. NREM and REM sleep are correlated with quantifiable ecological and physiological variables across evolution.
Positive and negative correlations are marked accordingly. Measured variables are listed centrally in color, with the impacted hypothesis for sleep function listed immediately below in parentheses. Except for brain mass, which was correlated with percent REM sleep, all variables were correlated with NREM or REM sleep durations. The unlabeled bottom loop shows that NREM and REM sleep are positively correlated with each other. Only mammals were used in these studies [48–51]. In cases in which one study was unable to detect a correlation, the positive outcome of another study is still shown based on the notion that correlations are inherently difficult to detect. Not shown: positive correlation between total sleep duration and ratio of cortical density to cortical surface area [75], which has been hypothesized to support a role for sleep in metabolic clearance from the brain [74].

