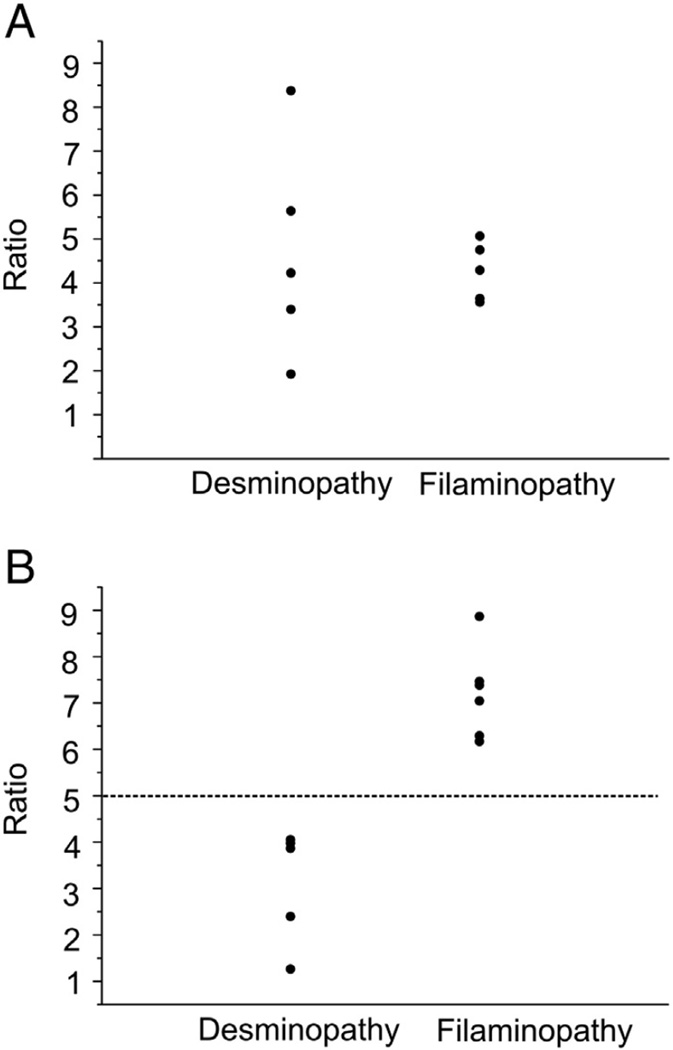
Fig. 1.
Individual ratios between spectral indices of aggregate and control samples for desmin and filamin C in desminopathy and filaminopathy patients. A: Ratios for desmin between aggregate and control samples in five desminopathy and six filaminopathy patients. The ratios were calculated for each individual using spectral index calculation by summing up all spectral counts belonging to the respective protein. B: Ratios for filamin C between aggregate and control samples in five desminopathy and six filaminopathy patients.

