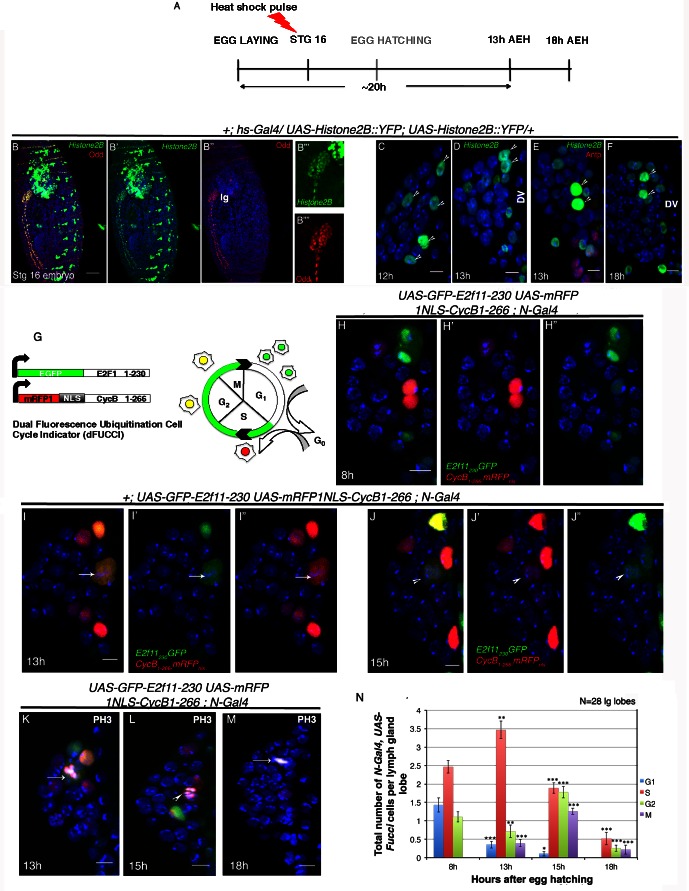
Figure 2. Cell cycle analysis of label retaining Notch expressing cells in first instar lymph gland of Drosophila.
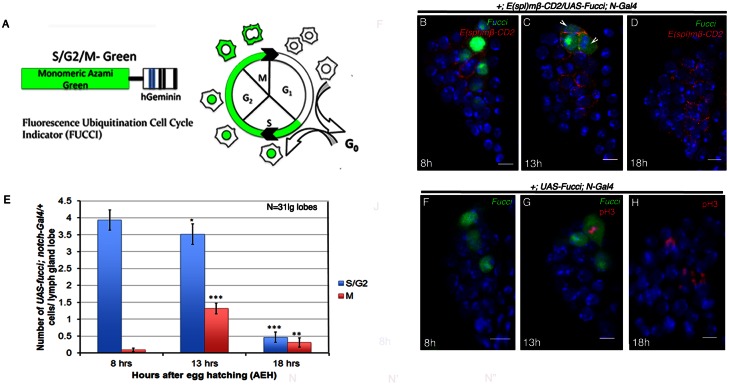
(A–F) Transient activation of UAS-Histone2B::YFP by hs-Gal4 following scheme in (A) shows labeling of all cells of the embryonic lg at 2 hr post hs ([B–B""]; red; odd; n = 10). (C–F) Subsequent analyses of the rest of the embryos at 12 hr ([C]; n = 18), 13 hr ([D–E]; n = 20) and 18 hr (F; n = 10) AEH, reveals few high YFP cells near DV retaining label (shown by arrow-heads). (G) The dual Fucci system in fly. Cells fluoresce green in G1, red in S and yellow in G2-M phases of cell cycle. (H–H") At 8 hr AEH, N expressing cells are predominantly in G1 (only green) and S (only red) phases of cell cycle, whereas by 13 hr (I–I"), majority of these cells can be seen piling up in S phase (p=0.00121289, n = 28, two tailed unpaired Student’s t-test). Mitosis (cytoplasmic yellow, arrow, I) in these cells can also be detected from 13 hr onwards (p=0.00027463, n = 28, two tailed unpaired Student’s t-test). (J–J") show cell cycle status of N expressing cells at 15 hr, where they can now progress into G2 (yellow (J), p=1.79435E-05, n = 28, two tailed unpaired Student’s t-test) and M phases of mitosis (yellow, arrow head, p=8.49479E-09, two tailed unpaired Student’s t-test). (K–M) PH3 labeling in the lymph gland 13 hr and 15 hr AEH (M) No Fucci signal can be detected at 18 hr AEH (S phase, p=4.17476E-08; G2 phase, p=1.26203E-10; M phase, 2.30293E-07; n = 28; two tailed unpaired Student’s t-test). (N) Quantitative analysis of results from H–M. Average number of cells in each phase of cell cycle was counted and plotted. DV= Dorsal Vessel. Scale bar = 5 μm. Error bars=SE. Genotypes are shown on top of corresponding panels. DAPI marks the nucleus. Hours after larval hatching are as indicated in each panel.


