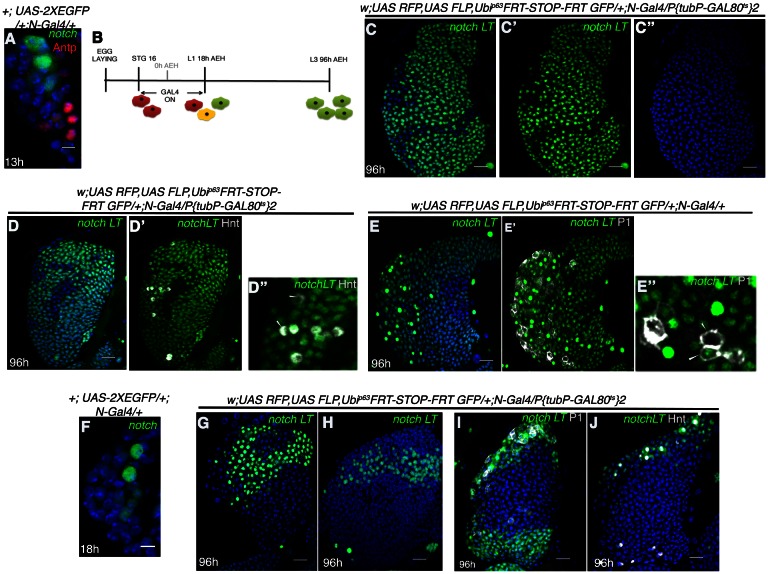
Figure 3. Notch expressing cells in first instar lymph gland of Drosophila are multipotent.
(A) N-GFP expression in a first instar lymph gland. N expression is detectable only till late first instar (also see Figure 1[E, M–O]). (B–E") shows that activation of G-TRACE with N Gal4, in a short window (following scheme in B) results in labeling of majority of the cells of third instar lymph gland. N lineage traced cells (green; [C–E"]; n = 15) include both crystal cells ([D'-D"], hnt, grey; n = 10) and plasmatocytes ([E'–E"], P1, grey; n = 10). (F) N expression is reduced to 2 cells by about 18 hr AEH (n = 7). (G–H) show that restrictive lineage tracing of one (H; n = 6) or two (G; n = 8) HSCs result in a clonal propagation, which spans through the entire horizontal length of the gland. (I–J) Each of these cells is equipotent in giving rise to both plasmatocytes ([I], P1, grey, n = 9) and crystal cells ([J], hnt, grey; n = 9). Scale bar = 5 μm for Figure 3A and F, for rest is 20 μm Genotypes are shown on top of corresponding panels. DAPI marks the nucleus. Hours after larval hatching are as indicated in each panel. Also see Figure 3—figure supplement 1–2.


