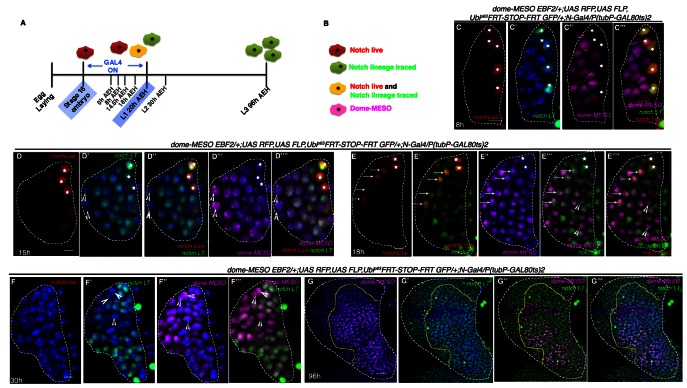
Figure 5. Hierarchical relationship between dome and Notch expressing cells in the first instar lymph gland.
(A) Show the scheme of N lineage tracing followed throughout this panel. (B) Schematic representation of predicted cell types arising from N lineage tracing in A. A red cell indicates live expression of N. A green cell indicates that N was active in this or its precursor cell but is not active now. A yellow cell indicates continuous activation of N>GTRACE indicating that this cell expressed N earlier and is still expressing. A magenta cell indicates dome-MESO expression. (C–C'") First instar lymph gland showing mutually exclusive yellow (both N live and lineage traced expression; stars) and magenta (dome-MESO-EBF2) cells at 8 hr (n = 6). (D–D''") also shows few N expressing cells (yellow; stars in D–D''") that do not express dome-MESO-EBF2 (magenta; D'"–D''"; n = 7) at 15 hr. (E–E''") At 18 hr, some N expressing cells (arrows; E–E''"; n = 6) also express dome (arrows; E"–E''"), while some do not (stars; E–E''"), indicating a possible differentiation at this time point. (F–F'") Second instar early (30 hr AEH) lymph gland does not actively express N (absence of red live expression in F) but contains N lineage traced cells (green; F', F"'; n = 5), which are now also expressing dome-MESO (magenta; F"–F'"). Also noteworthy are few cells (arrowheads) that are not lineage traced for N (not green) but still express dome (arrowheads, D–F'"). (G–G'") dome-MESO-EBF2 (magenta; G, G"–G'") expression in restricted N lineage (green; G'–G'") traced lymph gland following scheme in A. Scale bar is 20 μm for G–G"' for rest it is 5 μm. Genotypes are shown on top of corresponding panels. TOPRO marks the nucleus.


