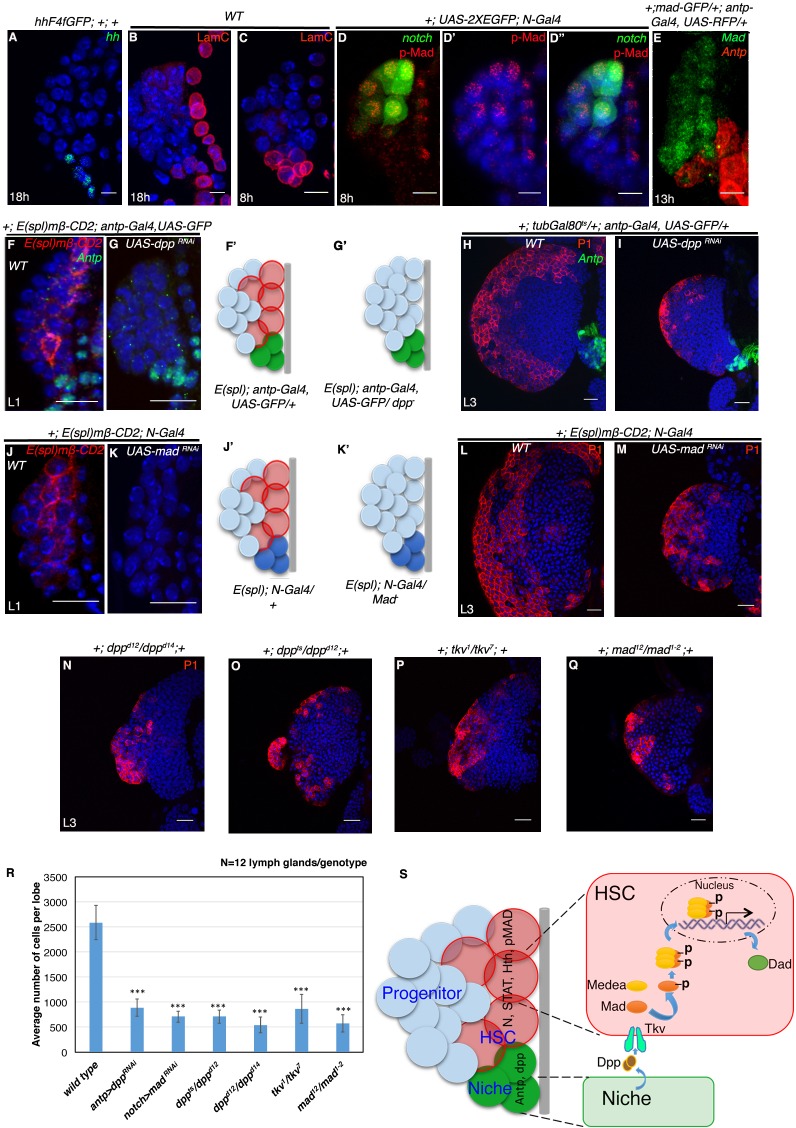
Figure 7. Requirement of Decapentapelagic (Dpp) from the PSC for hematopoietic stem cell maintenance in Drosophila.
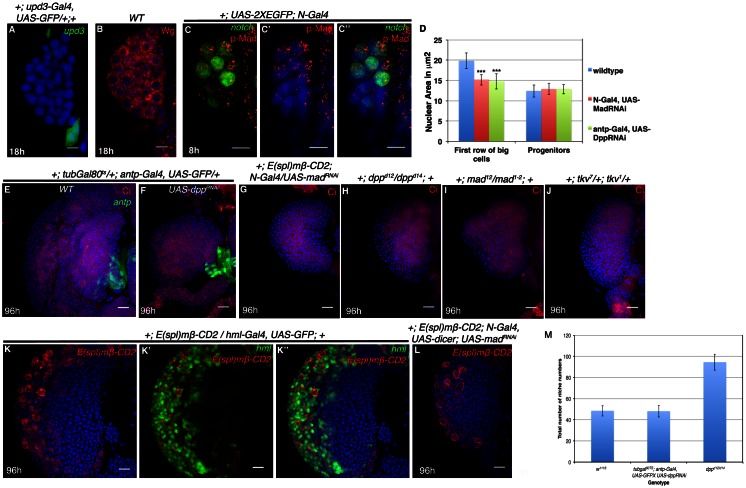
(A) The maintenance signal for progenitors: Hedgehog (green; n = 7) starts to express in lg at about 18 hr AEH. (B–C') Lamin C (red) is expression in the niche/PSC (green) in 8 hr and 18 hr lg. (D–D") pMad (red) labeling at 8 hr AEH is enriched in HSCs (N-GFP; n = 6). Also see Figure 7—figure supplement 1C–C". (E) shows that MadGFP expression is predominantly absent from the PSC (F–G’) In first instar lymph gland, HSCs can be visualized by E(spl)mβ -CD2 (red, [F]). Downregulation of Dpp function in the niche causes precocious loss of this HSC marker (E(spl), red, [G]). F'–G' represent scheme of results from (F–G). Also see Figure 7—figure supplement 1D. (H–I) shows that in a late third instar, above genotype causes a 3-fold reduction in the size of the lymph gland (P1, red, n = 15, p=3.98092E-10, two tailed unpaired Student’s t-test) in comparison to the control in H. However, CZ cells (P1 positive: plasmatocytes, red, [H–I]) are present in above genotype. (J–K') Attenuation of Mad expression by MadRNAiin the HSCs (K) also causes premature loss of HSCs (E(spl)mβ-CD2, red, N = 15; 18 hr). J'–K' represent scheme of results from (J–K). Also see Figure 7—figure supplement 1D. (L–M) depicts that this genotype in a third instar stage also results in 3.6 fold reduction in the lymph gland size in comparison to the control in (L), although P1 positive cells are still detectable (red, n = 15, p=7.27E-10, two tailed unpaired Student’s t-test; [M]). Also see Figure 7—figure supplement 1E and G and Figure 7—figure supplement 1K–L. (N–Q) The hetero-allelic mutant combination dppd12/dppd14 (n = 12; p=4.75E-11, two tailed unpaired Student’s t-test; [N]) or temperature sensitive mutant combination (dppts/dppd12; n = 12; p=3.76329E-10, two tailed unpaired Student’s t-test; [O]) causes a 3.6 and a 4.7 fold decrease in the size of the lymph gland respectively. Dpp receptor Thickveins (Tkv) mutant animals (tkv1/tkv7; n = 12; p=7.78E-11, two tailed unpaired Student’s t-test; [P]) as well as Mad deficiency (mad12/mad1-2; n = 12; p=3.81811E-11, two tailed unpaired Student’s t-test; [Q]) exhibit a similar decrease in the size. Like RNAi genotypes, in all classical loss of function, an analogous phenotype is seen. (P1, red; [N–Q]; compare with [L]). Also see Figure 7—figure supplement 1H–J (R) Quantification of the results from H–I and L–Q. Average numbers of cells per lobe are indicated. (S) Schematic representation of Dpp function in HSC maintenance. Dpp from the Antp expressing PSC is transported to pMad expressing HSCs (also expressing STAT, N, Hth), near the dorsal vessel to activate its receptor Tkv, leading to the nuclear translocation of Mad that maintains HSCs. Thus, loss of either Dpp from the PSC (G) or Mad (K) or loss of Tkv (P) from the N expressing cells results in precocious loss of HSCs. Scale bar = 5 μm for A-E and 20 μm for rest. Error bars=S.D. Figure 7 has one figure supplement.


