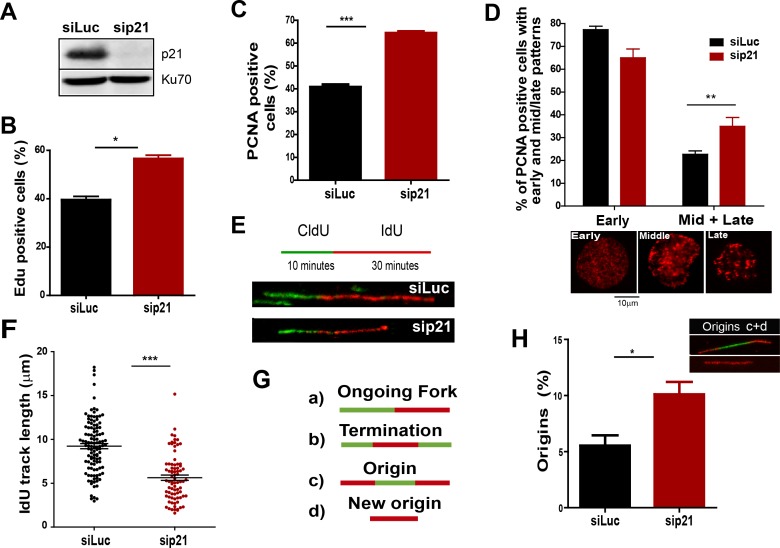
Figure 2. The depletion of endogenous p21 impairs the choreography of unperturbed DNA replication.
(A) Western blot (WB) analysis showing p21 levels in U2OS cells transfected with the indicated siRNAs. (B) EdU positive cells. 200 nuclei/sample were analysed in three independent experiments. (C) The percentage of cells with CSK-resistant PCNA nuclear retention. 300 nuclei/sample were analysed in three independent experiments. (D) Relative amount of cells with early or mid/late PCNA distribution. 100 nuclei/sample were examined in three independent experiments. (E) Representative fibers from control (siLuc) or sip21 transfected cells. (F) IdU track length. 100 fibers/samples were analysed in three independent experiments. (G) Schematic representation of the different structures that can be measured in the fiber analysis. (H) Samples in F were used to analyse the frequency of origin firing as the relative number of origins [(red-green-red + red only fibers)/total fibers]. 200 fibers/samples were analysed in three independent experiments.


