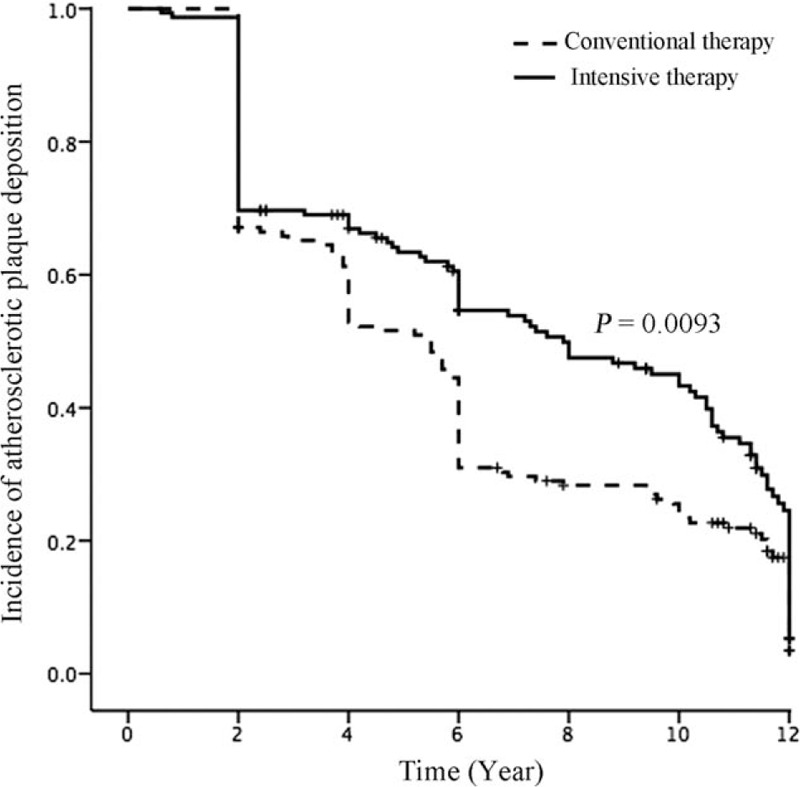
Figure 2.

Kaplan–Meier analysis of the differences in the risk of subclinical atherosclerosis between the treatment groups (P < 0.001 by the log-rank test).

Kaplan–Meier analysis of the differences in the risk of subclinical atherosclerosis between the treatment groups (P < 0.001 by the log-rank test).