
Figure 3.
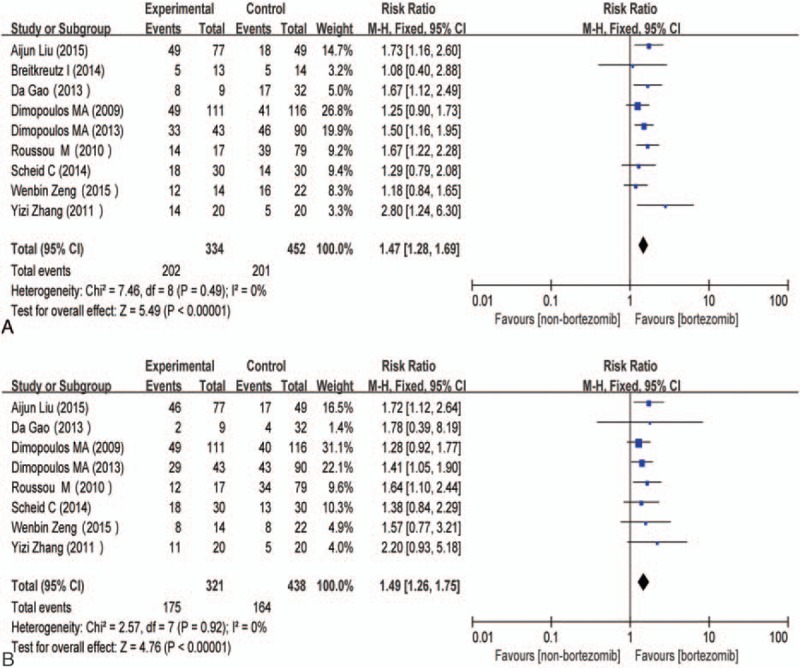
(A) Forest plot of renal overall remission with bortezomib-based versus non–bortezomib-based treatment for MM patients with renal insufficiency. (B) Forest plot of renal complete remission with bortezomib-based versus non–bortezomib-based treatment for MM patients with renal insufficiency. CI = confidence interval, control = non–bortezomib-based treatment, experimental = bortezomib-based treatment, MM = multiple myeloma.