Figure 4.

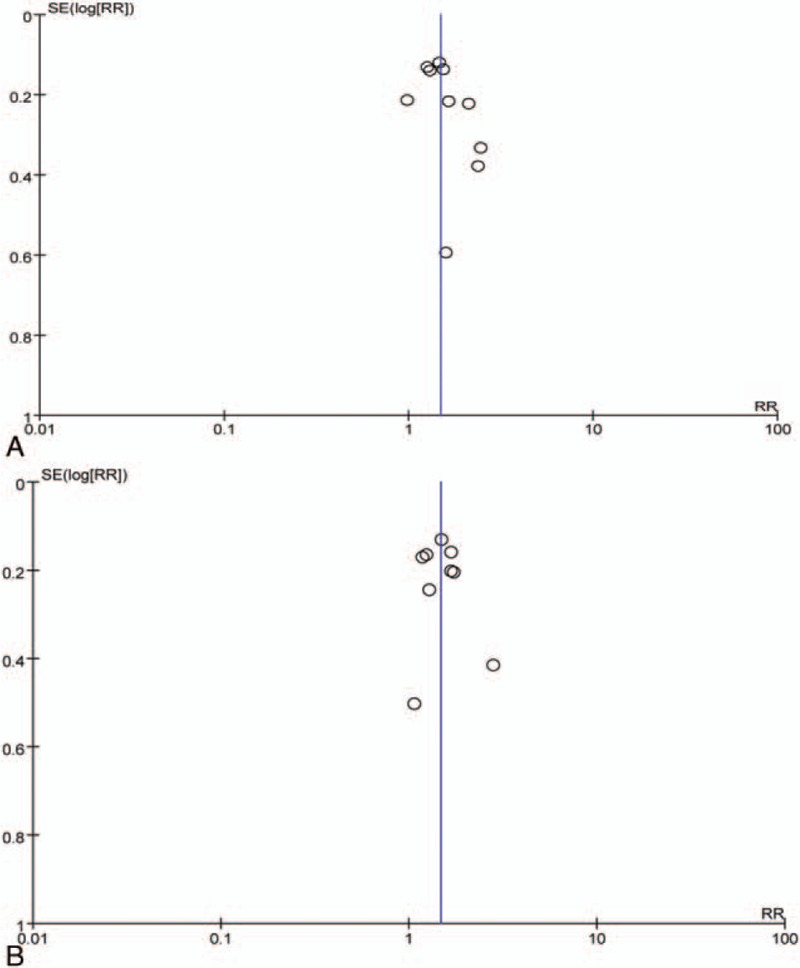
Funnel plot of included studies concerning (A) myeloma overall response and (B) renal overall remission. RR = risk ratio, SE = standard error.

Funnel plot of included studies concerning (A) myeloma overall response and (B) renal overall remission. RR = risk ratio, SE = standard error.