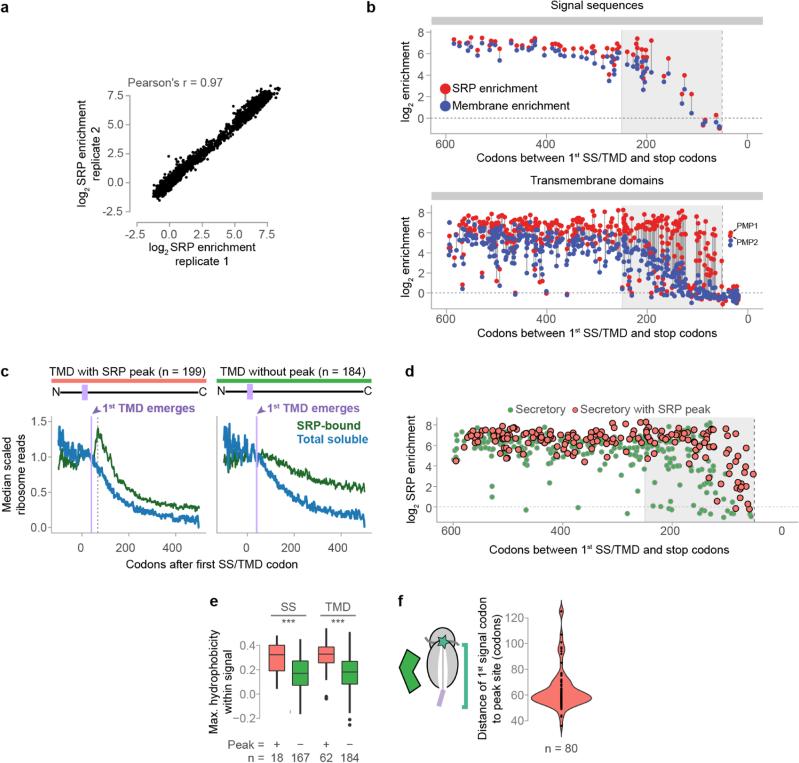
Extended Data Figure 2. Cotranslational enrichment of SRP.
a, Enrichment of ribosome-protected mRNA reads in the soluble SRP-bound polysome fractions over the total soluble polysome fractions from two biological replicates. b, The number of codons remaining after encoding of first SS or TMD residue, and the corresponding SRP and membrane enrichment scores per ORF. Scores are determined from cultures harvested without added cycloheximide. Enrichment scores are indicated with filled dots, and the scores from the same transcript are linked with a gray line. The vertical dashed line indicates 50 codons, the boundary for TA proteins. Here, only SS that bind Ssh1p directly upon exposure from the RNC are shown. c, Secretory transcripts were classified into two groups based on the ribosome protected-read distributions from SRP-bound polysomes. Some displayed a pronounced increase of reads at positions coincident with to the initial exposure of and SS or TMD by the ribosome, while others did not. Shown here are metagene analysis plots of soluble polysome protected reads from the categorized TMD proteins. For each ORF, the reads at each codon position were divided by the mean reads per codon within the range +20 to +40 after first signal codon. The first 30 codons of each ORF are excluded to avoid the characteristic low-density region near the start codon. The lavender line indicates when the first TMD begins to emerge from the exit tunnel, and the dashed line indicates the position of the read peak. Notably, the total soluble polysome reads depleted in a similar manner for both classes, a read increase was not observed in the total soluble reads, and reads from the SRP-bound transcripts with a peak did not deplete faster than the total soluble reads. These features are consistent with a model where SRP is recruited at the peak site, and elongation then proceeds at the same rate. d, The number of codons remaining after encoding of first SS or TMD and corresponding SRP enrichment. Transcripts are classified by the presence or absence of a read increase following signal exposure, as in c. Note that for SRP-enriched transcripts with signals closest to the terminus (<100 codons), evidence of direct binding between SRP and the nascent chain was always observed. SRP can therefore bind late transmembrane domains immediately after they become exposed by the ribosome. e, Maximum hydrophobicity across targeting signals using an 8-residue averaging window. Only signals with peaks that could be unambiguously attributed to a targeting signal were included. Hydrophobicity was determined by attributing the biological hydrophobicity score to each encoded amino acid54. ***p ≤ 0.001, Wilcoxon rank-sum test. f, Distribution of the distance between the first codon of a targeting signal and the position of the downstream read increase. Only transcripts wherein the increase can be unambiguously attributed to a specific targeting signal were included.

