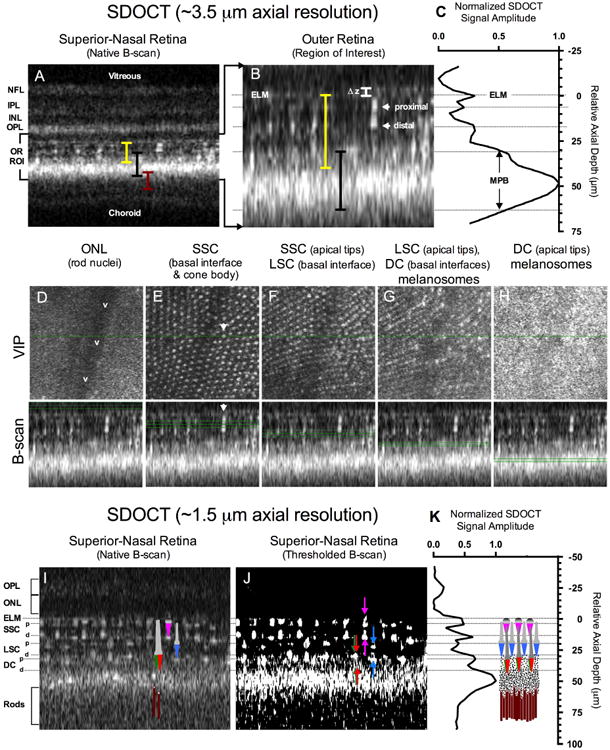
Figure 2.

SDOCT of the zebrafish outer retina using high (A-H) and ultra-high axial resolution (I-K). A full thickness B-scan (A) shows the approximate locations (colored bars) of the cone mosaic (yellow), melanin pigment zone (black), and rod outer segments (maroon). A magnified view of the region of interest (B) shows reflections from the proximal and distal (i.e. apical) aspect of a single cone photoreceptor. The LRP (C) of the SDOCT ROI (B) shows the intensity distribution as a function of depth relative to the external limiting membrane. Figures 2D-H Volume Intensity Projections (VIP) corresponding to the B-scans obtained from the various locations (green lines) within the cone mosaic and MPB. Figures 2I-K show the improvements made in resolving the stacked cone layer architecture by increasing the axial resolution by ∼ 3-fold. A color schematic of the zebrafish cone (SSC-magenta, LSC-blue, DC-Red/Green) and rod (maroon) photoreceptor types has been overlaid onto the B-scan image (Fig. 2I). A thresholded B-scan is provided in Fig. 2J to better accentuate the cone proximal (down arrows) and distal (up arrows) reflections. A LRP obtained from Fig. 2I is shown in Fig. 2K with a 1:1 scaled schematic of the zebrafish cone mosaic, MPB and rod outer segments adapted from Bracheck and Bremiller 1984 and Hodel et al. 2006. As can be observed in Fig. 2I, anatomical correlates to the ELM and cone proximal (b) and distal (a) tips are easily visible and align effortlessly with the model depicted in Fig. 2K. Increasing LRP reflectivity in the area of the double cones is apparent and originates from melanosomes containing pigment granules. The pigment granules reach the point of highest density (LRP Maxima @ ∼50 μm relative to the ELM in Fig. 2K) between the double cones and rod outer segments. SDOCT image dimensions are: (A) 0.3 mm (depth) × ∼0.25 mm (width), (B) 0.085 mm (depth) × ∼0.25 mm (width), (D-H) ∼0.25 mm2 (VIP window axes) by 0.085 mm (B-scan depth), and (I & J) 0.13 mm (depth) × ∼0.25 mm (width).
