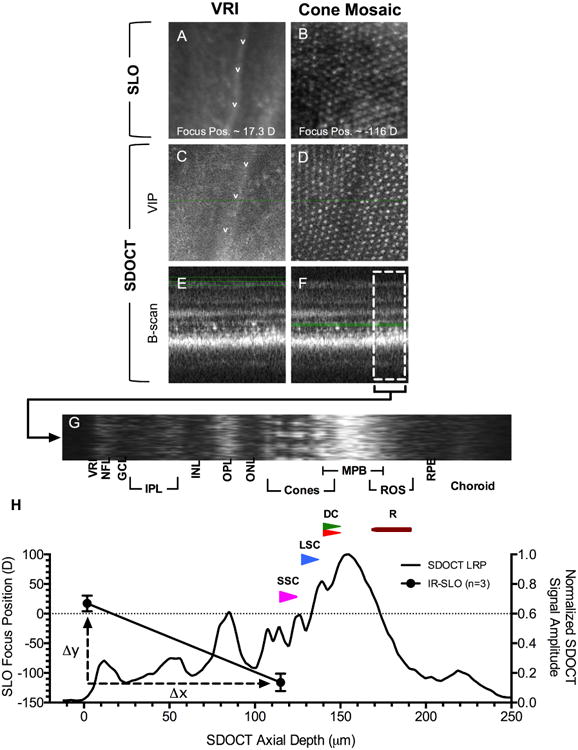
Figure 3.

Calibration of SLO focus position with SDOCT imaging data. En face views of the VRI and proximal cone mosaic using IR-SLO (A-B) and SDOCT (C-D). SDOCT VIPs for the VRI (C) and mosaic (D) were obtained from the regions bound by green lines shown (E & F), respectively. Fig. 3H shows an LRP obtained from the B-scan region of interest (F; white broken line box) that is rotated and displayed horizontally (G) above the graph. SLO focus position (mean±sd) in diopters for the VRI and cone mosaic is overlaid with the LRP data. SSC, LSC, DC, and rods are represented by magenta, blue, red/green, and maroon, respectively.
