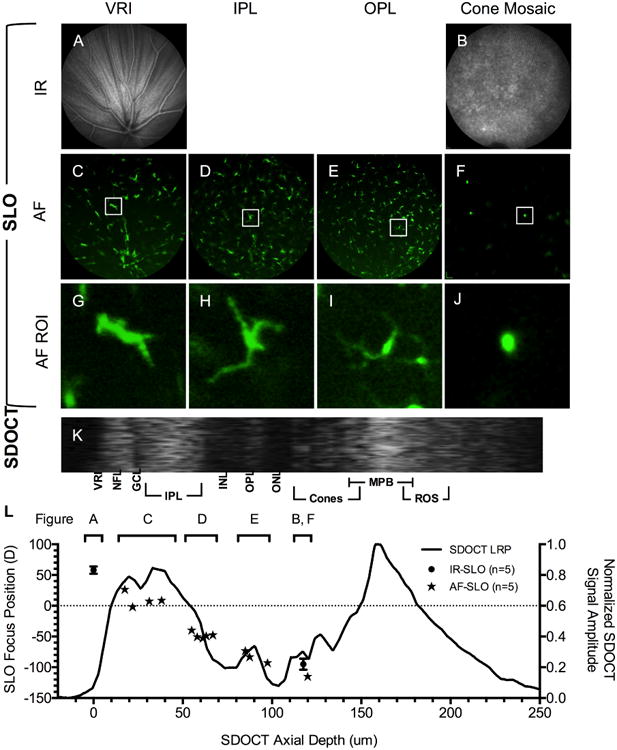
Figure 6.

In vivo optical sectioning of Tg(mpeg1:EGFP) extending from the VRI to the cone mosaic using IR- (A-B) and AF-SLO (C-F). Individual EGFP+ microglia have been isolated, digitally cropped, and expanded to better accentuate cellular detail (G-J). Figure 6K is an SDOCT ROI image from the same animal. The LRP (L) was obtained from the SDOCT ROI (K). An overlay of SLO and SDOCT data (K) shows the location of EGFP+ microglia cells identified by SLO relative to various retinal lamina. Data from multiple animals (n=5) are included to show population distributions of microglia cells within the retina. Zoomed views (G-J) demonstrate that SLO is capable of resolving dendritic processes and recognizing morphological differences in cells that are potentially in an active phagocytic (J) vs. resting state (G-I).
