
Figure 1. Strategy of visualizing chromatin under force.
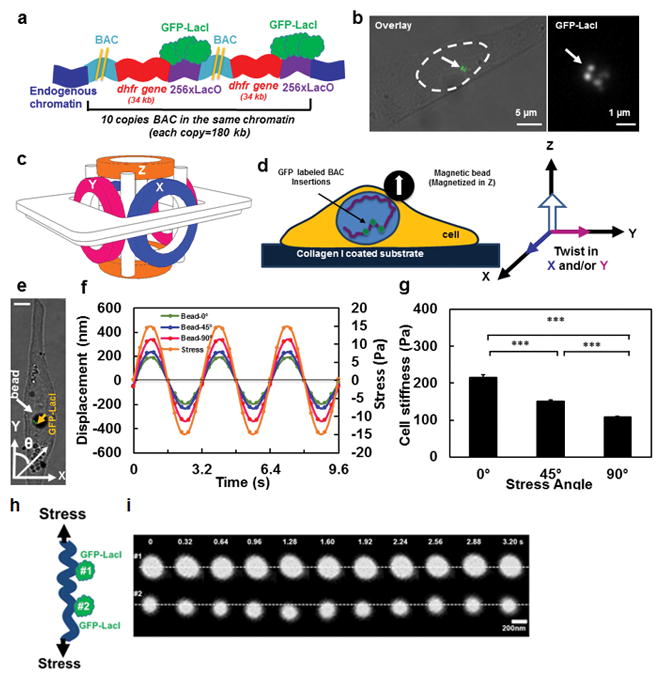
(A) Schematic representation of transgene insertions and fluorescence labeling of chromatin in live cells (Not drawn to scale) 26. Two yellow lines represent the long sequence of BAC. A stable cell line of DHFR D10 clone was used that had an insertion of 10 copies of the BAC into the same chromatin domain without any intervening CHO (Chinese Hamster Ovary) genomic DNA26. Here for visual simplicity only 2 copies of BAC (with DHFR gene and LacO) are drawn. (B) GFP tagged chromatin domains are shown inside the nucleus of a living CHO cell. Left image: nucleus is outlined by dashed lines; the brightfield image is overlaid with the fluorescent image. Right image: the magnified GFP-LacI image of the same cell; an arrow point to chromatin domains tagged with multiple GFP spots. (C) Schematic representation of the 3D Magnetic Twisting Cytometry (3D MTC). (D) A ferromagnetic bead was attached to the apical surface of the cells via integrins. A new strategy of altering stress angle but keeping stress amplitude constant was employed by which the bead was magnetized in Z direction and twisted in specified angles toward the X–Y plane by simultaneously modulating the amplitudes of the magnetic fields in X and Y directions. (E) A live CHO cell with a 4-μm ferromagnetic bead (a white arrow points to a solid black circle) with the GFP labeled chromatin (a yellow arrow points to the green spots). θ represents the angle of bead rotating direction with respect to the long axis of the cell (this notation applies to all cells in all figures). Scale bar, 5 μm. (F) Displacements of the center of the magnetic bead at the stress angle of θ=0º, 45º, or 90º in the same cell as in (E). Each displacement value is an average of data from 3 cycles. In all stress directions, the amplitudes of the sinusoidal magnetic fields (at 0.3 Hz) were modulated such that the peak stress amplitude remained constant at 15 Pa. The peak bead displacement was smaller along the long-axis of the cell than along the short axis. Note that due to a slight non-alignment between 0° stress angle (Y-axis) and the long axis of the cell in (D), thus 0° is in fact ~10°. Since the loading is cyclic and sinusoidal, a minus stress sign in (F) only represents the opposite direction of loading from the plus stress sign. (G) The dependence of cell stiffness (the ratio of the applied stress to the measured strain) on stress angles. Cell length to width ratio equals 2.84±0.377. Mean ± s.e.m.; n=30 cells, 21 independent experiments; *** P<0.001. (h) Schematic of two GFP spots of chromatin being deformed under stress. (i) Distance between two GFP spots (#1 and #2, corresponding to #2 and #3 GFP spots in Fig. 2d) in the same chromatin increases under a cyclic stress applied via integrins. Stress = 17.5 Pa at 0.3 Hz. Two white dashed lines are drawn only for visual aid.