
Figure 2. The extent of chromatin stretching depends on stress directions.
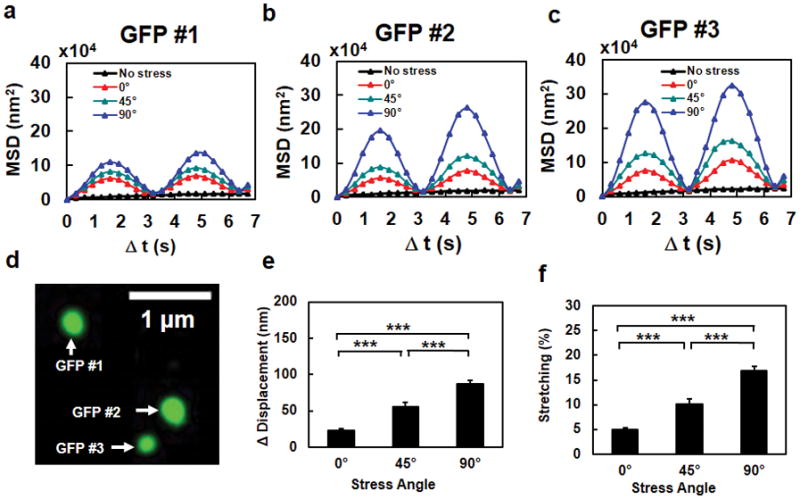
Mean Squared Displacement (MSD) of individual GFP spots #1 (a), #2 (b), and #3 (c) in a representative cell (the same cell as in Fig. 1e), when the stress (15 Pa at 0.3 Hz) was applied at 0º, 45º, or 90º. The black dashed lines in a, b, and c were the no stress control. It is apparent that the MSD was largest when the stress was applied along the transverse direction relative to the long axis of the cell. Data from 7 cycles of displacements are averaged in MSD curves. (d) The fluorescent image of the three GFP spots in the same chromatin of the cell. (e, f) Chromatin stretching (both peak stretching amplitude in (e) and % stretching in (f)) depends on stress angles. The increase of distance between any two GFP spots (Δ Distance) as a function of the stress angle at a constant peak stress (15 Pa at 0.3 Hz) represents the extent of chromatin stretching. Note that % stretching represents “an apparent stretching of the chromatin”, i.e., the distance between two spots on the chromatin is increased; it does not suggest that the chromatin molecule itself is stretched or elongated. The peak compressing amplitude and % compressing were similar to those of stretching. Mean ± s.e.m; n=90 GFP spots from 30 cells of 21 separate experiments; *** P<0.001.