
Figure 4. Rapid initiation of force-induced gene transcription.
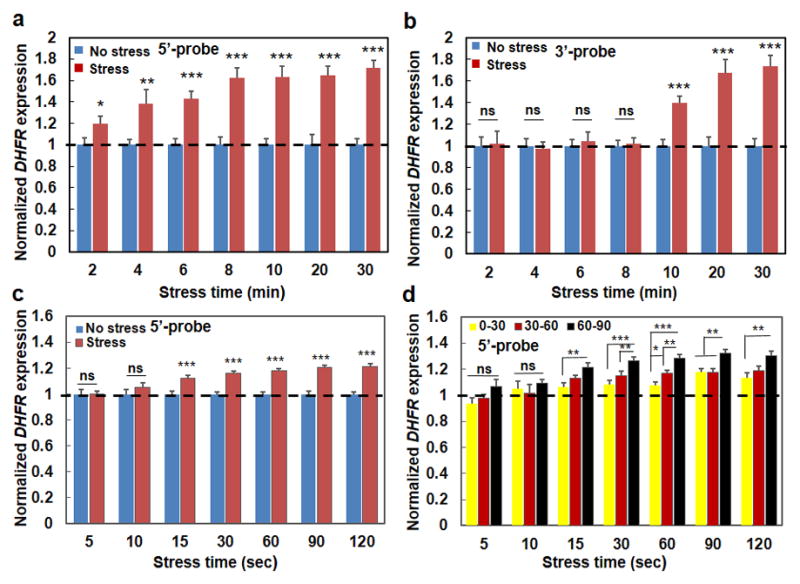
(a) Normalized transcription when fluorescently-labeled 5′-end-probes were utilized to probe the first 1700 bps of the DHFR transcripts (see Methods). Mean±s.e.m.; at 2, 4, 6, 8, 10, 20, 30 min, n=31, 29, 26, 20, 16, 13, 23 cells for Control conditions (cells in the same dish but no bead and applied stress); n= 21, 15, 32, 28, 21, 23, and 29 cells for Force conditions (stress=17.5 Pa at 0.3 Hz); 3 separate experiments; * P<0.05; ** P<0.01; *** P<0.001; in all cases the stressed cells were compared with their control counterpart cells at the same time. No statistically significant differences were observed between 6 min force with 8 min force (p=0.0883), or between 8 min force and 10 min force (p=0.9785). (b) Normalized transcription when fluorescently-labeled 3′-end-probes were utilized to probe the last 2000 bps of the DHFR transcripts (see Methods). Mean±s.e.m.; at 2, 4, 6, 8, 10, 20, 30 min, n=24, 22, 33, 15, 15, 16, 18 cells for Control conditions (no stress); n= 13, 19, 15, 16, 21, 16, and 18 cells for Force conditions (stress=17.5 Pa at 0.3 Hz); 3 separate experiments; *** P<0.001; ns=not statistically significant. There were significant differences between 10 min force and 20 min force (p=0.0351); no statistically significant differences were observed between 20 min force and 30 min force (p=0.7163). (c) Early time upregulation of transcription. 5′-end-probes were used. No stress: cells in the same dish but without the beads (no stress). Stress: stress applied at 17.5 Pa and 0.3 Hz. Bead binding alone did not have any effect on DHFR transcription (when comparing cells with beads and cells without beads). Mean±s.e.m.; at 5, 10, 15, 30, 60, 90, 120 sec, n=35, 25, 50, 56, 43, 44, and 45 cells for No stress; n=36, 37, 69, 59, 71, 51, and 61 cells for Stress conditions; three separate experiments. (d) Early time transcription is stress angle dependent. 5′-end-probes were used. Mean ± s.e.m.; at 5, 10, 15, 30, 60, 90, 120 sec, n=11, 15, 24, 20, 24, 27, 14 for 0°–30°, n=12, 11, 27, 22, 25, 22, 19 for 30°–60°, n=13, 11, 18, 17, 22, 12, 18 for 60°–90°, respectively. For (c and d); three separate experiments; * P<0.05, ** P<0.01, *** P<0.001; ns=not statistically significant. For simplicity, controls (No stress) data that are shown in (c) are not re-plotted in (d) and are only represented with a dashed line. All data in (d) at various stress angles 15 sec or more after stress application are significantly higher than No stress conditions (all P<0.001). Dashed lines in (a, b, d) are only for visual aid.