
Figure 5. Structural basis of force transfer to stretch chromatin.
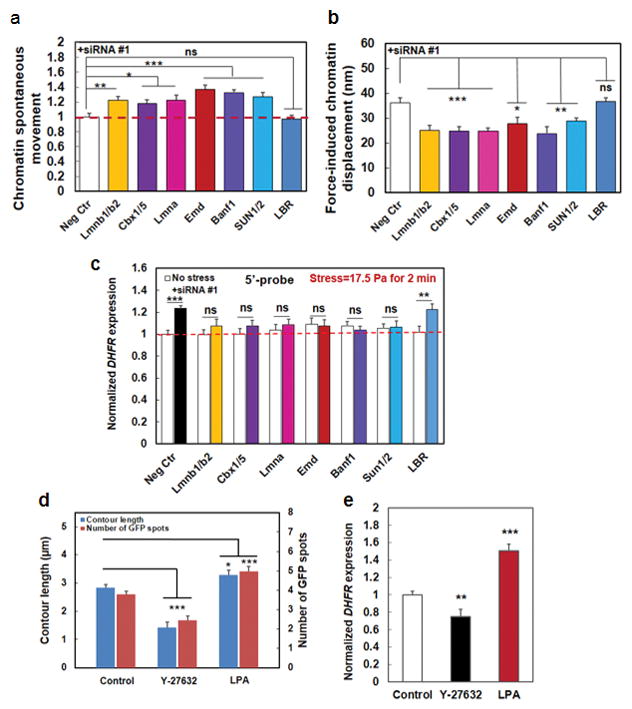
(a) Summarized data of quantification of the mean (frame-to-frame; 300 ms per frame) chromatin spontaneous movements without externally applied forces. All conditions were normalized to Neg Ctr; those that were treated with scrambled siRNA. Mean ± s.e.m.; n=36 (Control baseline movements=20.97±1.04 nm), 61 (Lmnb1/2, both Lmnb1 and Lmnb2 were silenced), 44 (cbx1/5, both cbx1 and cbx5 were silenced), 37 (Lmna), 56 (Emd), 41 (Banf1), 48 (SUN1/2, both SUN1 and SUN2 were silenced), 35 (LBR) cells, respectively; 3 separate experiments. * P<0.05; ** P<0.01; *** P<0.001. The red dashed line is drawn for visual aid only. (b) HP1 and BAF proteins, in addition to lamin A, lamin B, Emerin, and SUN1/2, transmit stresses from Lamins to chromatins. Lmnb1 and 2, Lmna, Emd, Banf1, HP1 (Cbx1 and 5), SUN1/2, and LBR genes were silenced using siRNA and local oscillatory forces are applied to the cell surface using MTC (8.8 Pa at 0.3 Hz). Force-induced displacements of GFP-LacI labeled chromatin transgenes were measured. Neg Ctr: force-induced displacements after scrambled siRNA treatment. Mean ± s.e.m.; n=10, 9, 9, 5, 10, 5, 28, 26 cells for Neg Ctr, Lmnb1&2, Cbx1&5, Lmna, Emd, and Banf1, SUN1/2, and LBR respectively; 3 separate experiments; * P<0.05; ** P<0.01; *** P<0.001; ns=not statistically significant. (c) Summarized data for normalized DHFR transcription after knocking down individual nuclear proteins. Stress was applied at 17.5 Pa at 0.3 Hz for 2 min to CHO cells bound with RGD-coated magnetic beads. DHFR partial transcripts were detected using 5′-probes and FISH. No stress: cells in the same dish but no stress was applied. Neg Ctr: treated with scrambled siRNA. Mean±s.e.m.; n=49, 19, 25, 19, 26, 27, 25, and 19 cells for Neg Ctr, Lmnb1/2, Cbx1/5, Lmna, Emd, Banf1, SUN1/2, and LBR silenced conditions under no stress; n=49, 18, 18, 17, 31, 32, 24, and 30, respectively for the corresponding conditions with applied stress. 3 separate experiments. ** P<0.01; *** P<0.001; ns=not statistically significant. Red dashed line is for visual aid only. (d) Summarized data for contour length (length of the line connecting GFP spots) and the number of GFP spots (number of active transgenes) without (Control) and with Y-27632 (20 μM for 30 min) or LPA (with 2 μgml−1 for 60 min) treatment. Y-27632 treated cells had shorter contour lengths and hence fewer GFP spots, indicating that the chromatin is more condensed; LPA treated cells exhibited opposite phenotypes, suggesting that the chromatin is more decondensed. Mean ± s.e.m.; n=48, 26, 28 cells (contour lengths and GFP spots) for Control, Y-27632, and LPA conditions, respectively; 3 separate experiments. * P<0.05; *** P<0.001. (e) Gene regulation by stress depends on actomyosin tension. Stress was applied via RGD-coated beads. Control: untreated cells stressed at 17.5 Pa and 0.3 Hz for 60 min; Y-27632: cells pretreated with 20 μM Y-27632 for 30 min before stress was applied for 60 min; LPA: cells pretreated with 2 μgml−1 LPA for 60 min before stress was applied for 60 min, Mean ± s.e.m.; n=31, 28, 53 cells for Control, Y-27632, and LPA conditions, respectively; n=3 separate experiments; ** P<0.01; *** P<0.001.