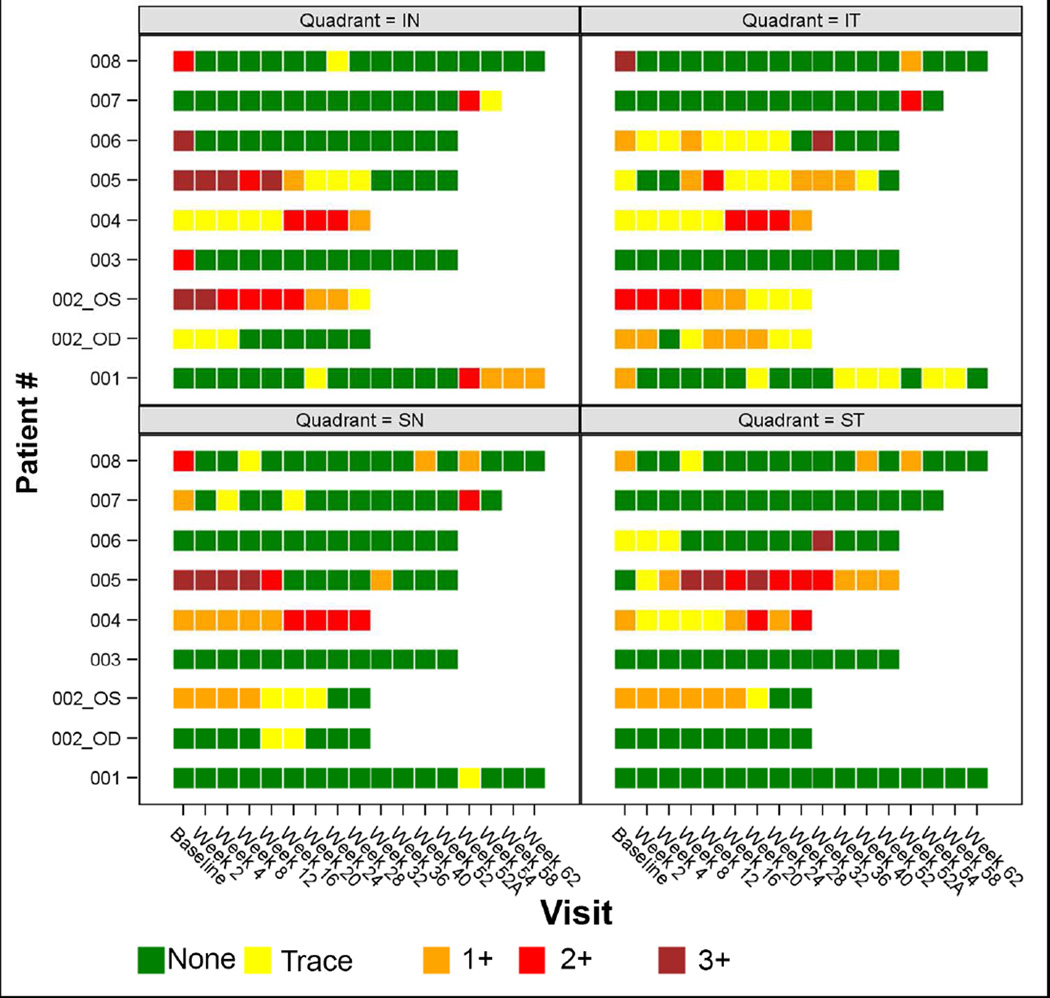
Figure 2.
Graphical representation of clinical scleral grades for all patients. Each scleral quadrant is represented separately. Green blocks represent an inflammatory score of 0, yellow blocks represent trace (0.5+), red blocks represent 2+, and maroon blocks represent 3+. Visit week 52A designates enrollment in the second extension phase, and was different for the three patients (1, 7 & 8) averaging 6.2 months after their week 52 visit.

