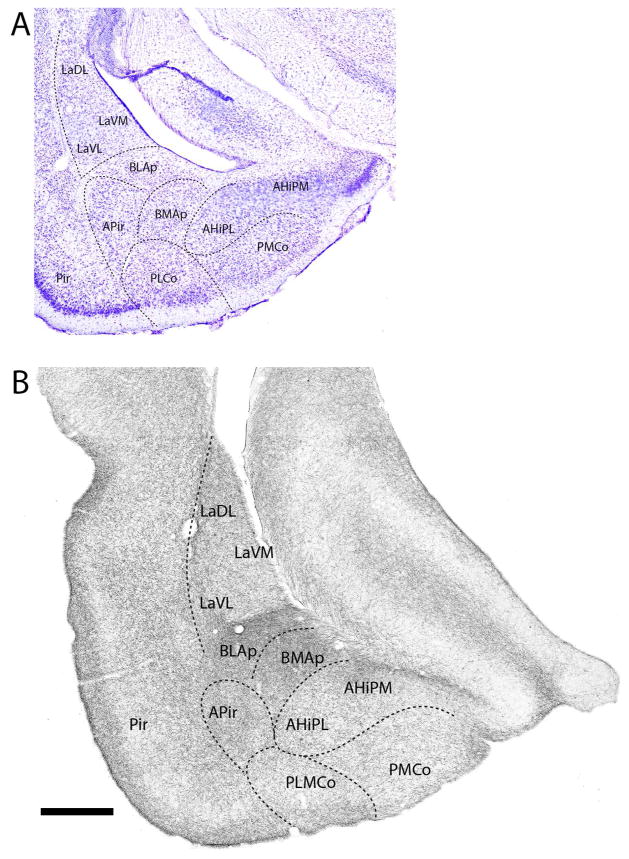
Figure 11.
A: Low magnification Nissl-stained transverse section through the posterior amygdala showing the locations of nuclei at this level. B: Pattern of distribution of 5-HT fibers to nuclei of the amygdala at the same level. Note the dense labeling of the posterior part of the basomedial and basolateral nuclei. See list for abbreviations. Scale bar for A = 750 μm; for B = 500 μm.

