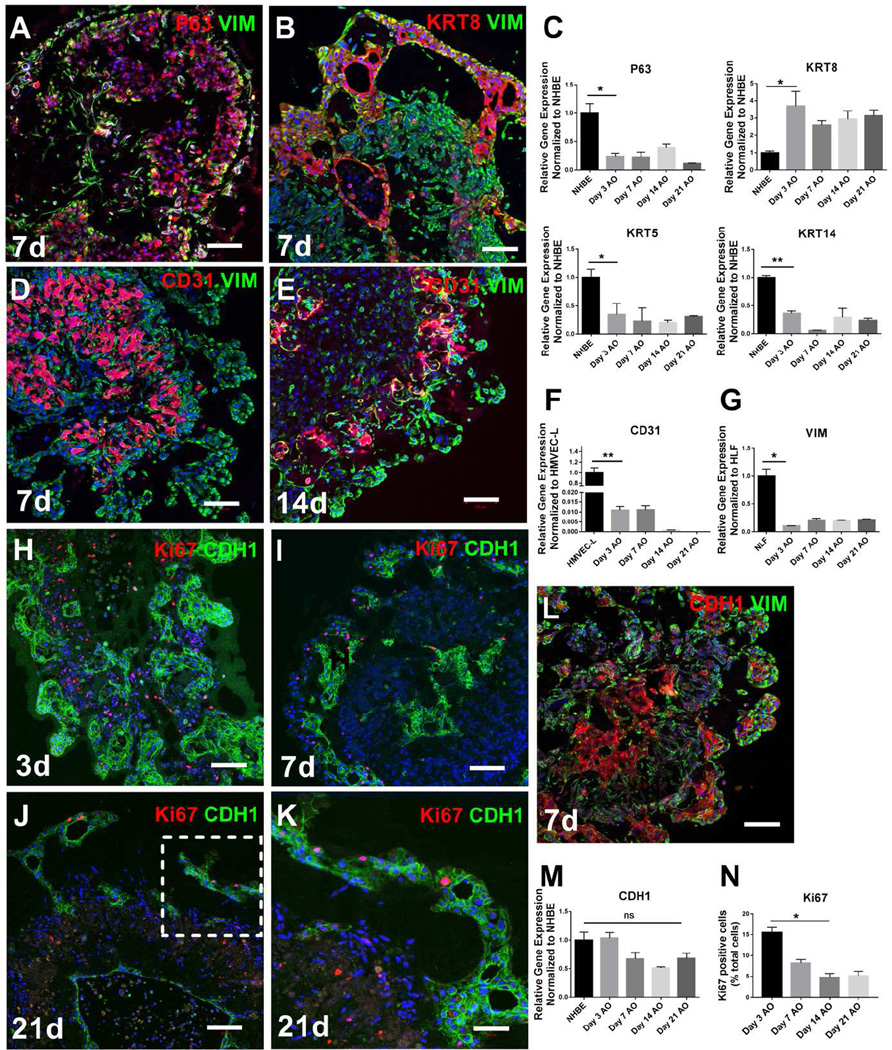
Figure 2.
Self-organization of cells within airway organoids. P63 (red, A), KRT8 (red, B) and E-cadherin (CDH1, red, L and green, H, I, J, K) positive epithelial cells clustered together and were also visualized in close contact with vimentin positive mesenchymal cells in airway organoids at day 7 (A, B, L). CD31 positive cells also clustered together with close interactions with vimentin positive (green) cells in the airway at day 7 (D) and day 14 (E). Relative gene expression of P63, KRT5, KRT14, KRT8, vimentin, CD31 and CDH1 in the airway organoids at different time points was compared to NHBE (C, M), HMVEC-L (F) or HLF (G) cells in traditional 2D monocultures. Proliferation was assessed by ki67 (red) in the airway organoids at various time points (H, I, J, K) and quantified (N). Values in graphs represent mean ± SEM; n=3, *P < 0.05; **P < 0.01; t-test. Scale bars, 100µm (A–J), 50µm (K).

