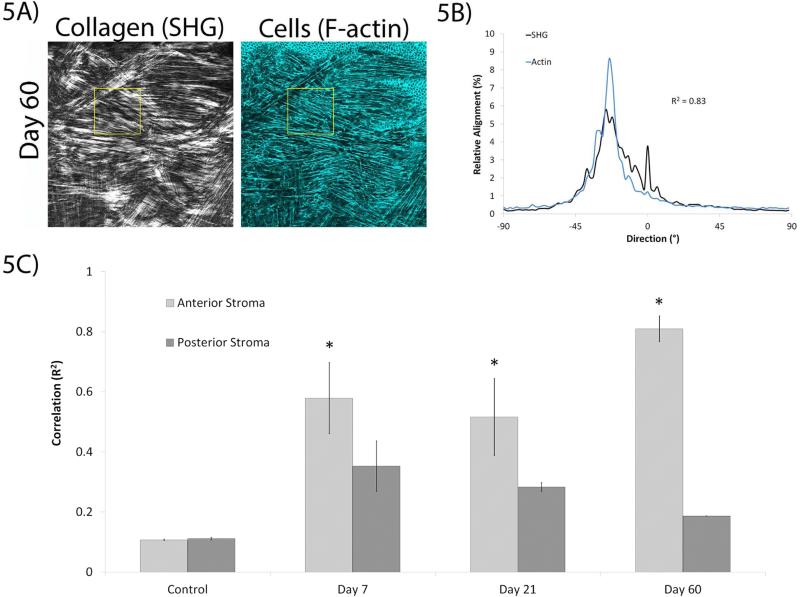
Figure 5.
Directionality analysis was used to quantify correlation at each time point. Directionality analysis was conducted using smaller regions within an image (the yellow boxed region in (A)), which generated corresponding output shown in (B, from the yellow boxed region). C) Alignment of cells with collagen in different regions of the cornea at all time points. Images in (A-E) are 465 μm × 465 μm. (* P < 0.05 compared to posterior stroma and control, ANOVA).

