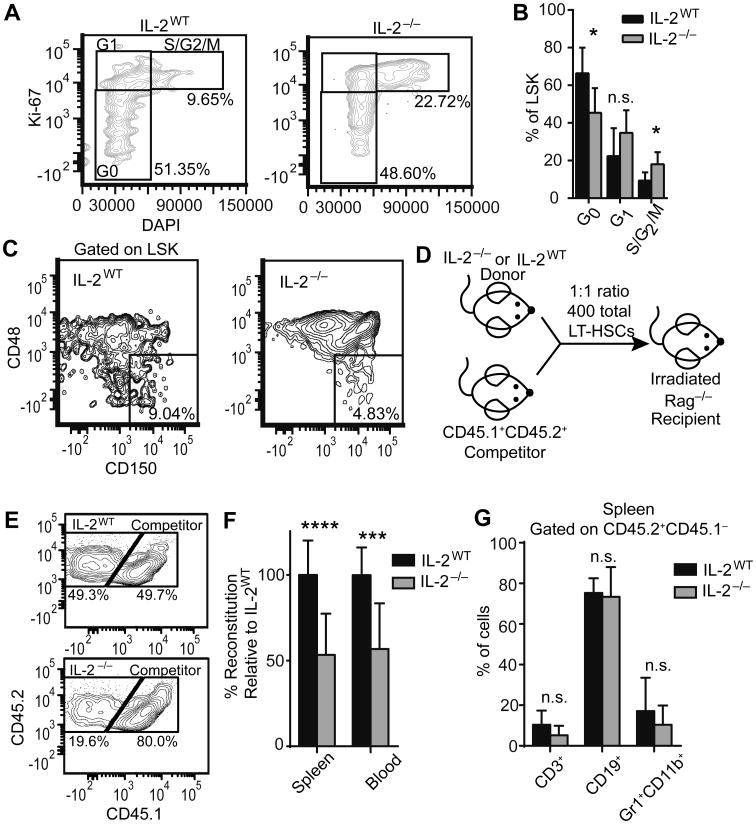
Figure 2. IL-2−/− HSCs have increased proliferation and a competitive reconstitution disadvantage.
HSCs from 19-21 day old IL-2WT or IL-2−/− mice were analyzed (A-C). Representative flow plot of RBC-lysed BM stained for DAPI and Ki-67, gated on LSK HSCs, to determine proliferation stages (A). Frequencies of LSK HSCs in G0, G1, and S/G2/M stages of cell cycle (B). Representative plot of BM stained for long-term HSCs (LT-HSCs) defined as LSK CD150+CD48− (C). Schematic of LT-HSC competitive reconstitution strategy (D). LT-HSCs were FACS sorted from day 18-21 IL-2WT or IL-2−/− BM (CD45.2+CD45.1−) and age-matched CD45.2+CD45.1+ competitors. Cells were mixed at a 1:1 ratio with competitors and 400 total cells were injected via tail vein into lethally irradiated Rag−/− recipient mice. Mice were harvested at 5 weeks post-transfer to assess competitive reconstitution in peripheral blood and spleen. Representative flow plots of competitive hematopoietic reconstitution from IL-2WT LT-HSCs (E; upper) and IL-2−/− LT-HSCs (E; lower) in peripheral blood. Percentage reconstitution relative to IL-2WT LT-HSCs (F). Percentage of CD3+, CD19+ and GR1+CD11b+ cells within the CD45.2+CD45.1− fraction (G). (A-C) Data are from 2 independent experiments with n=7-10 mice per group. (D-G) Data are from 3 independent experiments with IL-2WT n=10; IL-2−/− n=12. n.s. - not significant; * p < 0.05; *** p < 0.001; **** p < 0.0001 based on students t test.

