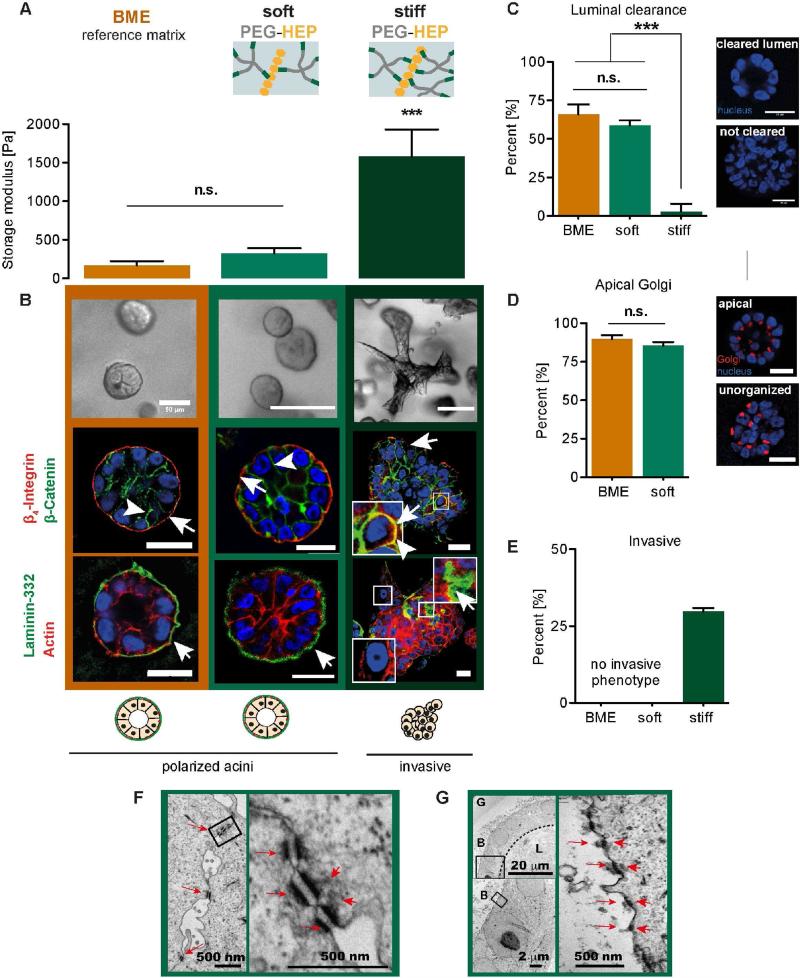
Figure 2. Soft, degradable PEG-HEP matrices support acinar morphogenesis of MECs.
(A) Storage modulus (Pa) of BME and soft and stiffPEG-HEP matrices (crosslinking degree of γ=0.63 and γ=1.25, respectively). (B) Top row: Bright field images of MEC colony morphology after culture in reference BME and soft and stiff PEG-HEP matrices (scale bar = 100 μm). Middle/bottom row: Confocal immunofluorescence of polarization markers in MEC colony cross sections from BME and soft and stiff PEG-HEP matrices (scale bar = 20 μm). Middle row: Immunofluorescence images of MECs stained for polarity markers β4-integrin (arrows; red) and β-catenin (arrowhead; green), and nuclei (DAPI; blue). Bottom row: Immunofluorescence images of MECs stained for laminin-332 (arrow; green), actin filaments (red), and nuclei (DAPI; blue). (C) Left: Percentage of acini containing cleared lumens. Right: Representative images of DAPI-stained acini showing luminal clearance. (D) Left: Percentage of acini containing apically oriented Golgi apparatus. Right: Representative images of GM-130- (Golgi apparatus) and DAPI-stained (nucleus) acini showing orientation of the Golgi relative to the nuclei. (E) Percentage of acini showing an invasive (non-spherical) phenotype. (F and G) Ultra-structural analysis of MECs cultured in soft PEG-HEP matrices. (F) Left image shows several desmosomes (red arrows) at the epithelial cell-cell interface (scale bar = 500 nm). Right image is a magnified inset of the left image showing the desmosomes (red arrows) with connected cytoplasmic filaments (red arrowheads, scale bar = 500 nm). (G) The top left overview image is a representative MEC colony with cleared lumen (L). Note that the hydrogel (G) polymeric network appears degraded in the periphery of the basal (B) acini surface (scale bar = 20 μm). The left bottom image is a magnified inset of the left top image (scale bar = 2 μm). The right image is further magnified at the cell-matrix interface, showing the typical dense dark structures of hemidesmosomes (arrows), which are connected to cytoplasmic filaments (arrowheads, scale bar = 500 nm). G = gel, L = lumen, B = basal side of acini. A, C, D and E are mean ± S.D. (A) ANOVA with Tukey's multiple comparison, n = 3. (C) and (D) n = 50 acini counted from three independent experiments; un-paired t-test. (E) n = 100-150 from one representative experiment; Kruskal-Wallis test with Dunn's multiple comparisons. All images and measurements in this figure are of cells after 14 days in culture. n.s. = not significant; p ≥ 0.05; ** p < 0.01; *** p < 0.001.

