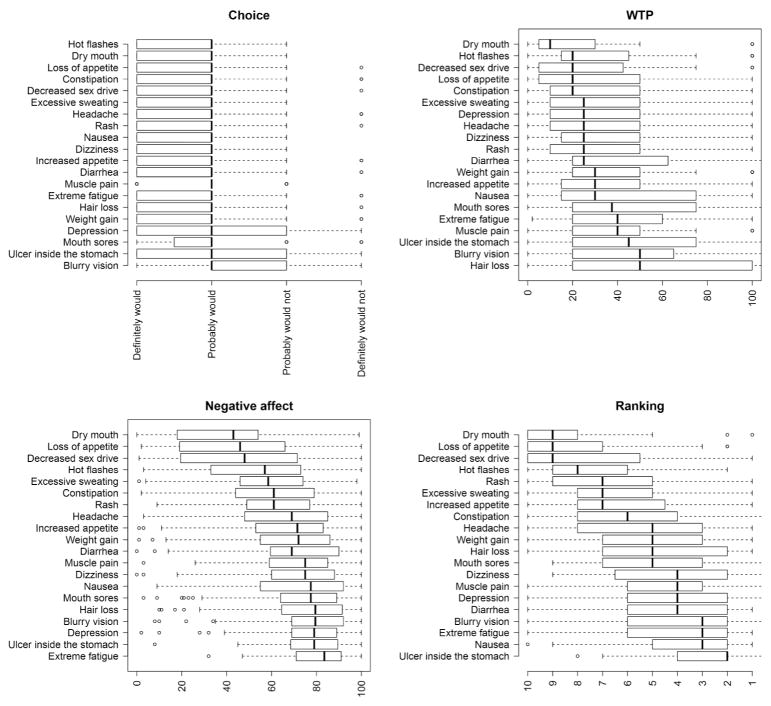
Figure 1.
Boxplots showing the distribution of the responses on the four aversiveness measures for each side effect, ordered by their respective means from least to most unattractive. Aversiveness ratings include the choice item (upper-left panel), the willingness-to-pay item (WTP; upper-right panel), the negative affective attitude item (bottom-left panel), and the ranking task (bottom-right panel).

