
Fig. 4.
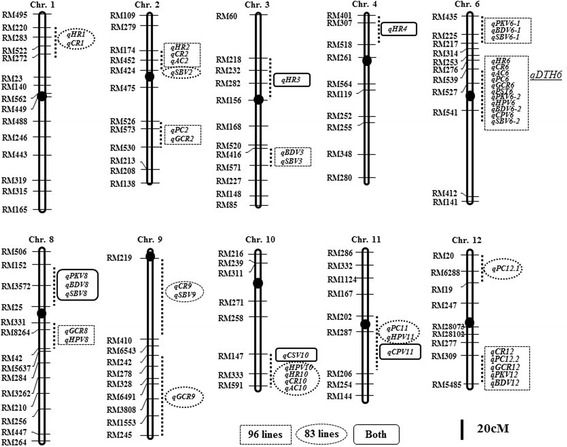
Map locations of the QTLs detected in this study. QTLs detected by single point analysis and interval mapping were represented to the right of the chromosome. QTLs detected in both groups, 96 ILs and 83 ILs are shown. qDTH6 for days to heading is shown on chromosome 6