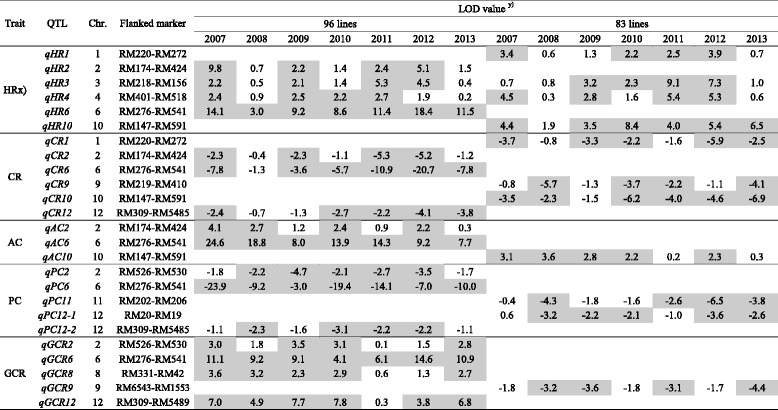
Table 3.
QTL information for rice quality traits in 96 and 83 introgression lines

x)Refer to Table 1 for trait abbreviations. y)QTL peak with LOD ≥ 2.1 are colored with gray, and negative values indicate that the O. rufipogon alleles increased the trait values
