
Fig. 2.
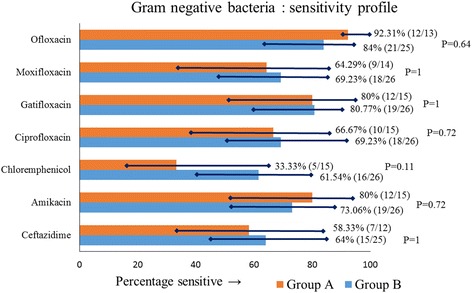
Antibiotic sensitivity profile of gram-negative isolates in groups A and B, showing percentage sensitivity with 95% CI
Official websites use .gov
A
.gov website belongs to an official
government organization in the United States.
Secure .gov websites use HTTPS
A lock (
) or https:// means you've safely
connected to the .gov website. Share sensitive
information only on official, secure websites.
Antibiotic sensitivity profile of gram-negative isolates in groups A and B, showing percentage sensitivity with 95% CI