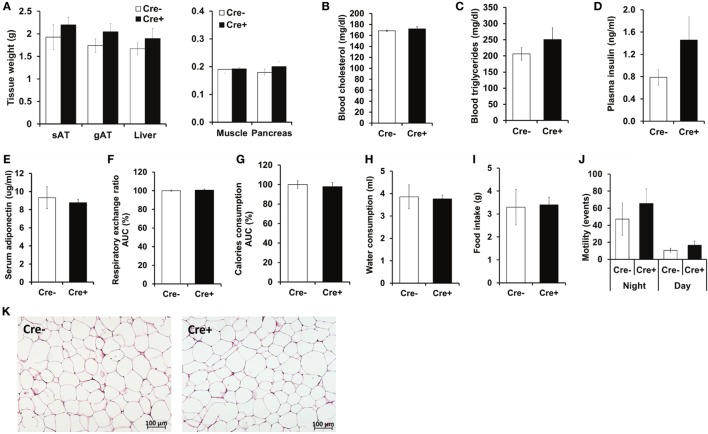
Figure 2.
No metabolic differences between obese mast cell-deficient and -proficient mice. (A) After 21 weeks on HFD, mice were euthanized and dissected. Tissues were collected, and their weights were recorded. sAT, subcutaneous AT; gAT, gonadal AT. (B,C) Levels of cholesterol and triglycerides in blood were measured after 16 h of starvation in obese mast cell-deficient and -proficient mice. (D) Insulin in the plasma from obese mast cell-deficient and -proficient mice was measured after 16 h of starvation. (E) Adiponectin in serum from obese mast cell-deficient and -proficient mice was measured. (F–J) Metabolic performance of obese mast cell-deficient and -proficient mice was analyzed by using comprehensive laboratory animal monitoring system (CLAMS) for three consecutive days and nights. (F) Respiratory exchange ratio (RER); data are shown as area under curve (AUC) of the experimental period (3 days and 3 nights together). AUC data are presented as % of control; the Cre-negative group was set as the 100% control. (G) Calories consumption; data are shown as area under curve (AUC) of the experimental period (3 days and 3 nights together). AUC data are presented as % of control; the Cre-negative group was set as the 100% control. (H) Cumulative water consumption at the end of the experimental period (3 days). (I) Cumulative food intake at the end of the experimental period (3 days). (J) Mouse motility (events/20 min) during light and dark period of the three consecutive days and nights was measured by recording motion events with infrared motion sensor. (K) Morphology of the gonadal AT from obese mast cell-deficient and -proficient mice was performed with hematoxylin/eosin staining; representative images are shown. Student’s t-test (A–E) and ANCOVA (F–J) with animal body weight as covariant were used for statistical evaluation, n = 8–10 mice [in (A–E)] and n = 4 mice/group [in (F–J)]. Data are expressed as means ± SEM.

