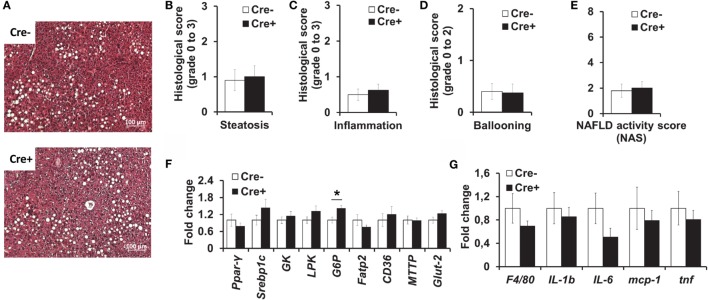
Figure 4.
No difference in liver inflammation and metabolism between obese mast cell-deficient and -proficient mice. (A–E) Liver hematoxylin/eosin-stained paraffin sections from obese mast cell-deficient and -proficient mice were analyzed histologically and evaluated for NAFLD activity score (NAS), consisting of steatosis, lobular inflammation, and hepatocellular ballooning; three sample images (400× power field) per animal were scored (n = 8–10 mice). Student’s t-test was used for statistical analysis; data are expressed as means ± SEM. (A) Representative images of the liver from obese mast cell-deficient and -proficient mice. (B) Liver steatosis was scored on a scale from 0 to 3. (C) Liver lobular inflammation was scored on a scale from 0 to 3. (D) Hepatocellular ballooning was scored on a scale from 0 to 2. (E) NAFLD activity score (NAS) represents the combination of steatosis, inflammation, and ballooning score on a scale from 0 to 8. (F,G) Quantitative PCR analysis from the livers of obese mast cell-deficient and -proficient mice was performed. Data are shown relative to the mast cell-proficient mouse group; 18S RNA was used for normalization. Non-parametric Mann–Whitney U test was used for statistical analysis; data are expressed as means ± SEM (n = 8–10 mice). (F) Quantitative PCR analysis of metabolic gene expression in the liver; *p < 0.05. (G) Quantitative PCR analysis of inflammatory gene expression in the liver.

