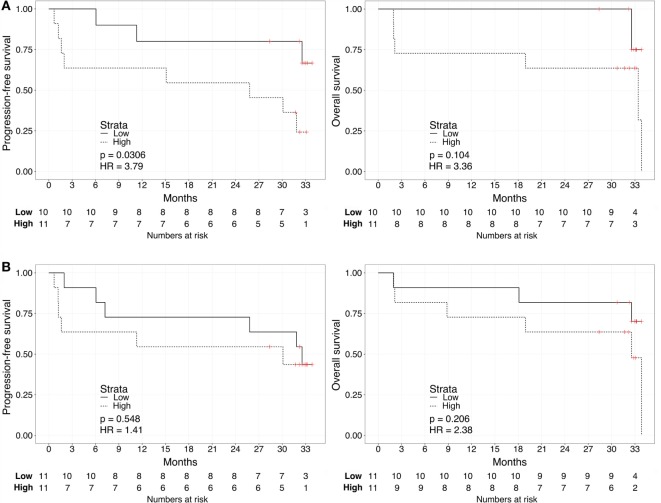
Figure 3.
Kaplan–Meier curves for PFS (left) or OS (right) limited to patients with metastatic ccRCC according to the urine (A) or plasma (B) biomarker score level. The prospective cohort of patients (N = 23) was classified as “Low” (solid) vs. “High” (dashed) biomarker score at the time of sampling.

