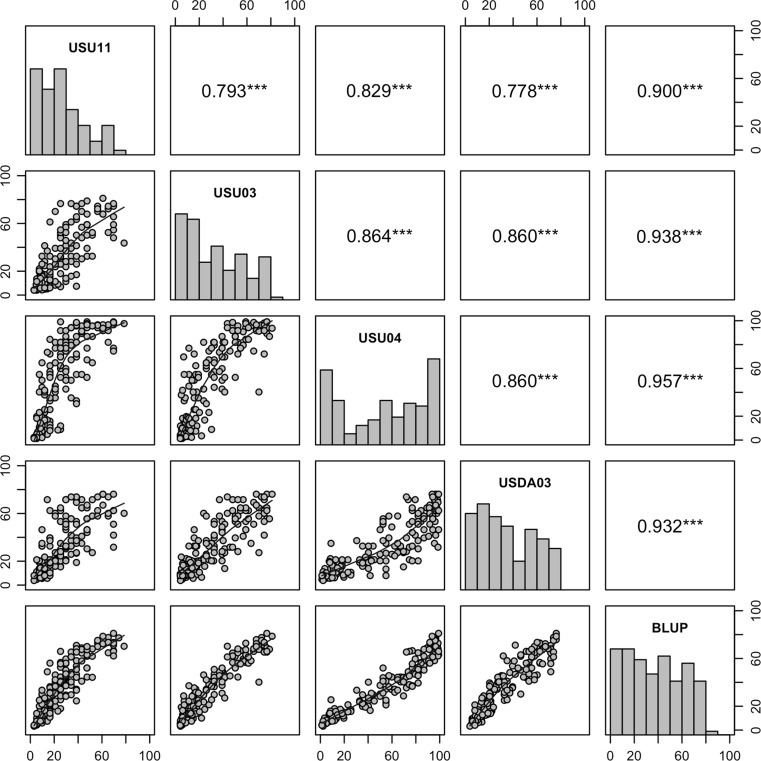
Fig. 1.
Distribution and correlation of dwarf bunt incidence (%) in the Rio Blanco x IDO444 population among individual environments and the best linear unbiased predictors (BLUP) over the four environments. The diagonal contains histograms of dwarf bunt incidence in each environment, scatterplots with a Lowess smoothing line between each environment in the lower diagonal, and the Spearman’s rank correlation coefficient in the upper diagonal with significance test (triple asterisk indicates significance p < 0.001)

