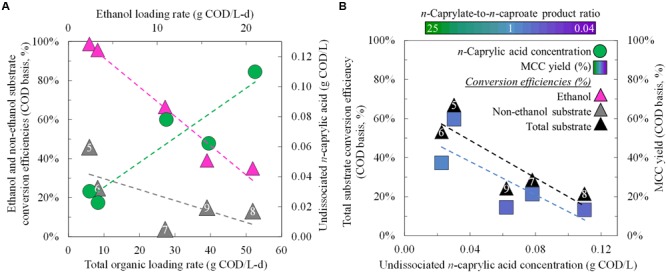
FIGURE 3.

Substrate conversion efficiencies and product yields for different operating and performance conditions during Period 5 (Phase II) and Periods 6–9 (Phase III). Substrate conversion efficiencies and undissociated n-caprylic acid concentrations were plotted as a function of the total organic and ethanol loading rates (A). Total substrate conversion efficiencies and MCC yields were each plotted as a function of the residual concentration of undissociated n-caprylic acid in the bioreactor broth (B). A color gradient was used within the squares for the MCC yield to show the n-caprylate-to-n-caproate product ratio (green-to-purple, respectively), with blue representing a more equal mixture of these two products. A white font within the triangles for the non-ethanol substrate conversion efficiency and the total substrate conversion efficiency identifies the five different operating periods.
