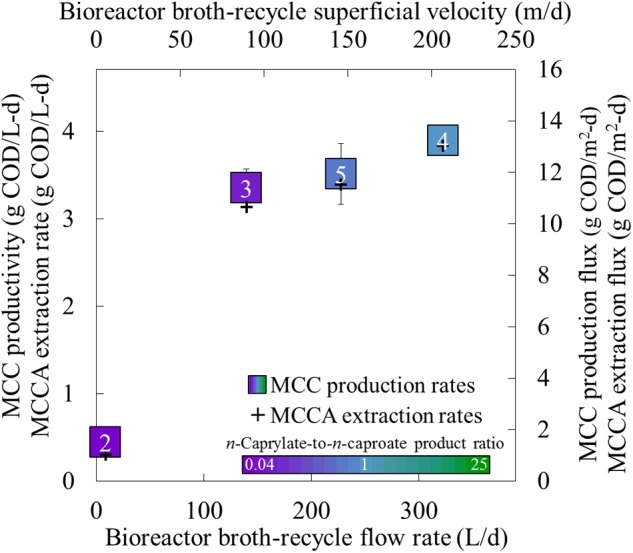
FIGURE 5.

Production performance parameters for different recycle rates in the forward membrane module during Periods 2–5. The MCC productivity, undissociated MCCA extraction rate, MCC production flux, and undissociated MCCA extraction flux were plotted as a function of the recycle rate. The broth-recycle (flow) rate (bottom axis) and broth-recycle superficial velocity (top axis) are alternative ways to represent the same recycle rate. The square for the production rate represents the productivity (left axis) and production flux (right axis), while plus for the MCCA extraction rate represents the extraction rate (left axis) and extraction flux (right axis). A color gradient was used within the squares for the production rate to show the n-caprylate-to-n-caproate product ratio (green-to-purple, respectively), with blue representing a more equal mixture of these two products. A white font within the squares for the MCC production rate identifies the four different operating periods. Productivity uncertainty is represented by 95% confidence intervals.
