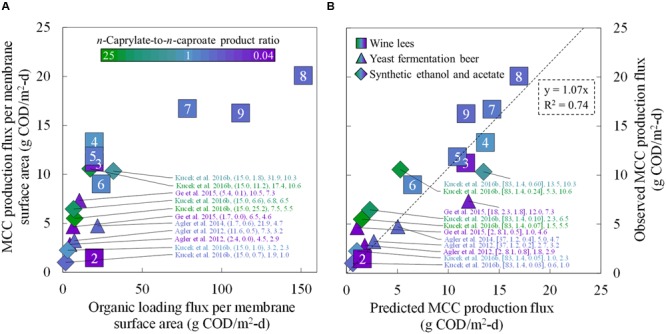
FIGURE 6.

Comparative MCC production fluxes for the present study during Periods 2–9 and for previously published studies. Observed MCC production fluxes were plotted as a function of the organic loading flux (A) and as a function of the predicted MCC production fluxes (B). We compared the MCC production fluxes from the present study (squares) to four reactor microbiome studies that employed in-line extraction and fed ethanol-rich substrates (triangles and diamonds) (Agler et al., 2012, 2014; Ge et al., 2015; Kucek et al., 2016b). In (A) the data labels include the: reference; (ethanol-to-non-ethanol substrate ratio; n-caprylate-to-n-caproate product ratio); organic loading flux; and MCC production flux. In (B) the data labels include the: reference; (broth-recycle superficial velocity; membrane surface area; undissociated MCCA concentration in the bioreactor broth); predicted MCC production flux, and observed MCC production flux. A color gradient was used within the squares, triangles, and diamonds for the n-caprylate-to-n-caproate product ratio (green-to-purple, respectively), with blue representing a more equal mixture of these two products. A white font within the squares for the present study identifies the eight different operating periods.
