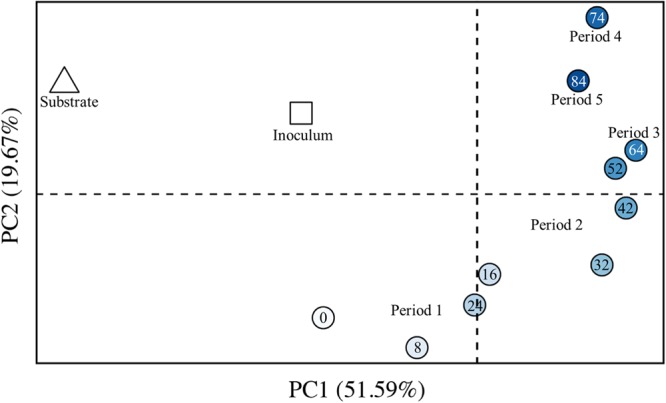
FIGURE 8.

Beta diversity for the inoculum, the substrate, and bioreactor samples from Periods 1–5. PCoA of weighted UniFrac distances was performed with sequence data for 12 microbiome samples, including: one inoculum sample (square); one wine lees substrate sample (triangle); three bioreactor samples from the batch phase (Period 1); and seven bioreactor samples from the phase of semi-continuous substrate addition with continuous in-line extraction (Periods 2–5) – bioreactor samples are shown by circles. The increasingly darker blue circles were collected at later days. The numbers within the circles indicates the collection day number. The increased distance between samples represents increased dissimilarity. The first two PCoA axes are shown, which together explain 72% of the overall phylogenetic variation between samples; PC1 explains 52%, while PC2 explains 20% of the overall phylogenetic variation.
