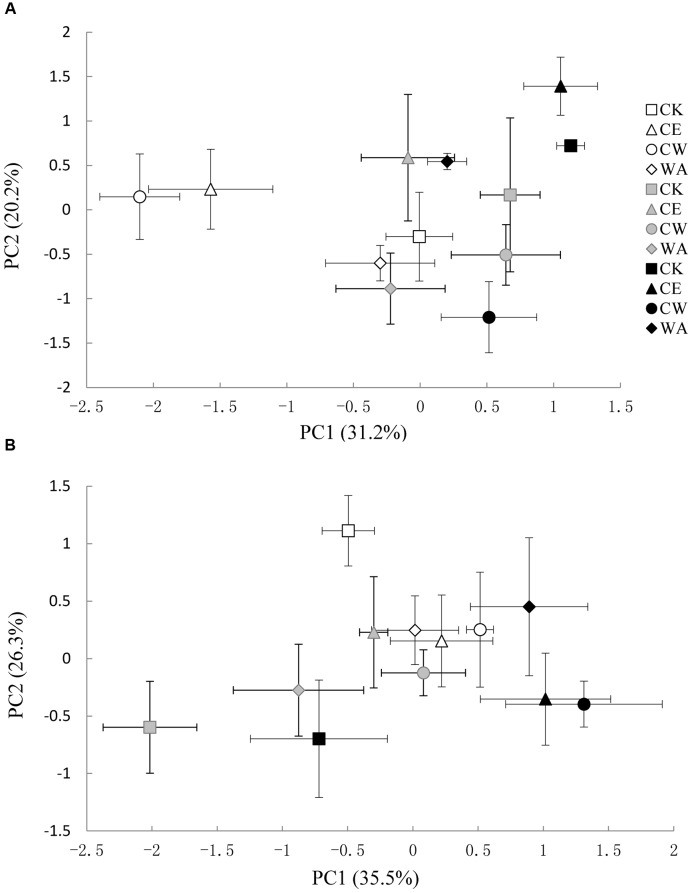
FIGURE 2.
Principal component analysis (PCA) of T-RFLP patterns of methanogens (A) and methanotrophs (B) from the studied soils. Tillering stage (white); Heading stage (light gray); Ripening stage (black). The symbols are as follows: ambient CO2 and ambient temperature (CK), squares; atmosphere CO2 enrichment (CE), triangles; atmosphere CO2 enrichment and warming canopy air (CW), circles; warming canopy air (WA), diamonds. The error bars indicate the standard error of the means.

