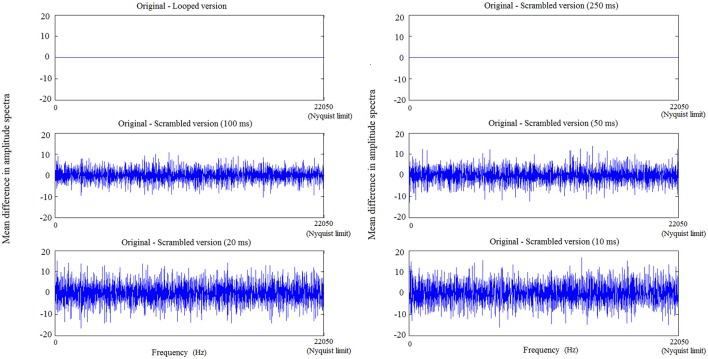
Figure 2.
Changes in frequency features—in low, mid and high frequency bands—of a CN due to looping and scrambling with increasing bin sizes. The maximal frequency on the X axis corresponds to the Nyquist frequency (22,050 Hz) and the spectrum amplitude difference between original and looped/scrambled versions of a CN is plotted on the Y axis. With decreasing bin size, the difference between the resulting scrambled sound and the original sound increases, leading to greater difference in amplitude spectrum from the original, across all the frequency bands.

