
Figure 3.
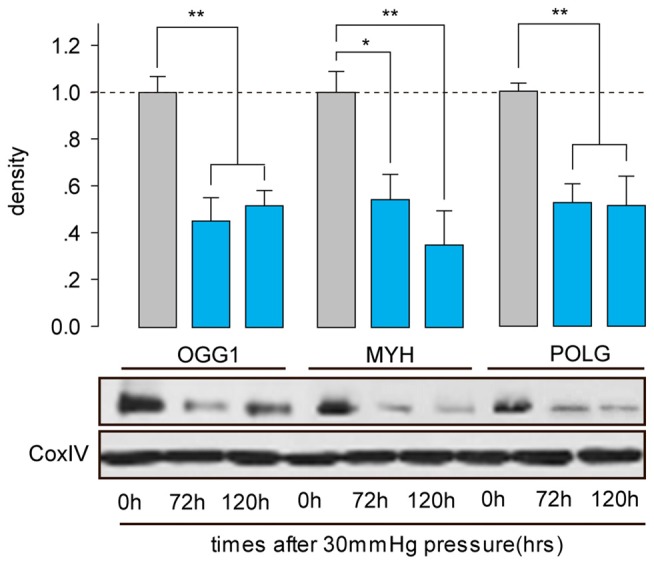
Western blot analysis showed that protein expressions of OGG1, MYH and POLG in the mitochondria of cultured RGCs decreased after exposure to increased HP. Cox IV was used as a control to ensure equal protein loading. Band density is expressed in normalized ratios (Ctrl = 1; n = 7/time point/group). *P < 0.05, **P < 0.01. Values are the means ± SEMs. HP, increased hydrostatic pressure; ctrl, control with normal pressure.