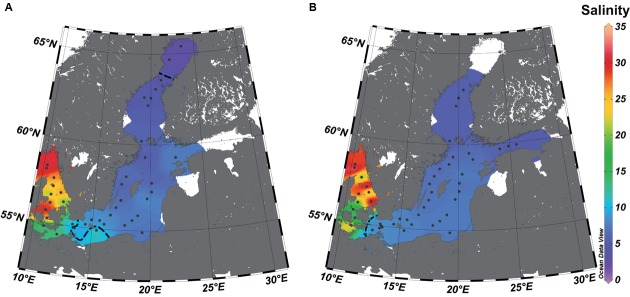
FIGURE 1.
Study area and sampling stations (dots) in the surface water along the salinity gradient of the Baltic Sea. The salinities were extrapolated based on the values (see Supplementary Table S1) of the stations from July (A) and February (B) by piece-wise linear regression using Ocean Data View 4.7. The dotted line represents the estimated transitions between the salinity areas (salinity 10 = transition marine–mesohaline; salinity 4 = transition mesohaline–oligohaline), and the white areas those with unreliable extrapolations.

