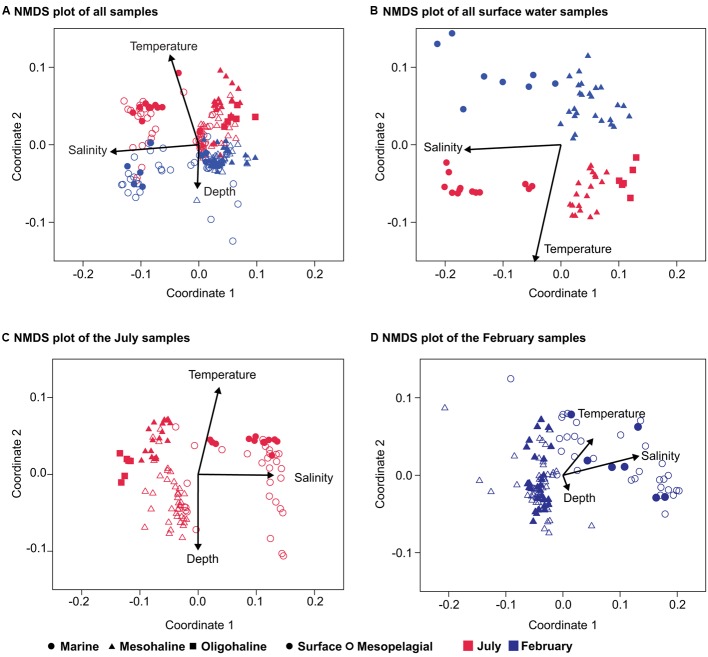
FIGURE 3.
Non-metric multidimensional scaling (NMDS) of the bacterial community composition in the Baltic Sea. (A) NMDS of all samples (stress 0.24); (B) only surface-water samples (stress 0.13); (C) NMDS plot of the July samples (stress 0.17); and (D) NMDS plot of the bacterial community composition in the February samples (stress 0.09). The environmental variables salinity, depth, and temperature were added as post hoc vectors to the NMDS graph representing the correlation coefficients between the environmental variables and the NMDS scores. Bold symbols are surface samples (0–10 m), and open symbols the mesopelagic (11–300 m). Samples from the February cruise are indicated in blue and those from the July cruise in red.

