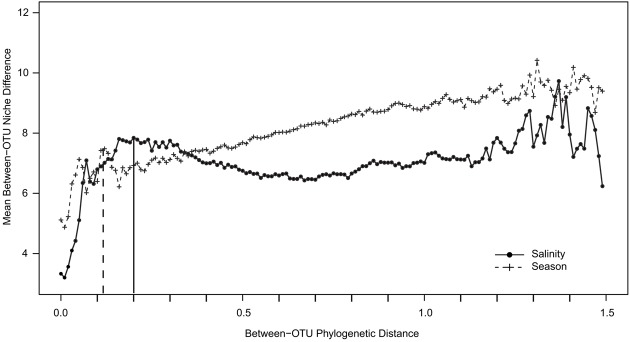
FIGURE 7.
Between-OTU niche difference as a function of between-OTU phylogenetic distance. The data points represent means of OTU niche differences within phylogenetic distance bins. Plus signs and filled dots represent niche differences with respect to salinity and season, respectively. The dotted vertical line gives the maximum peak for season; the bold vertical line gives the maximum peak for salinity.

