
FIGURE 6.
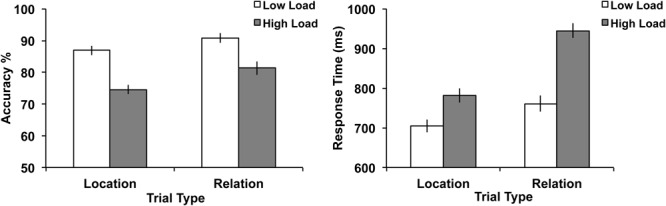
Behavioral results illustrating accuracy (left) and RT (right) for both trial types and load. Error bars represent standard error of the mean.
Official websites use .gov
A
.gov website belongs to an official
government organization in the United States.
Secure .gov websites use HTTPS
A lock (
) or https:// means you've safely
connected to the .gov website. Share sensitive
information only on official, secure websites.
Behavioral results illustrating accuracy (left) and RT (right) for both trial types and load. Error bars represent standard error of the mean.