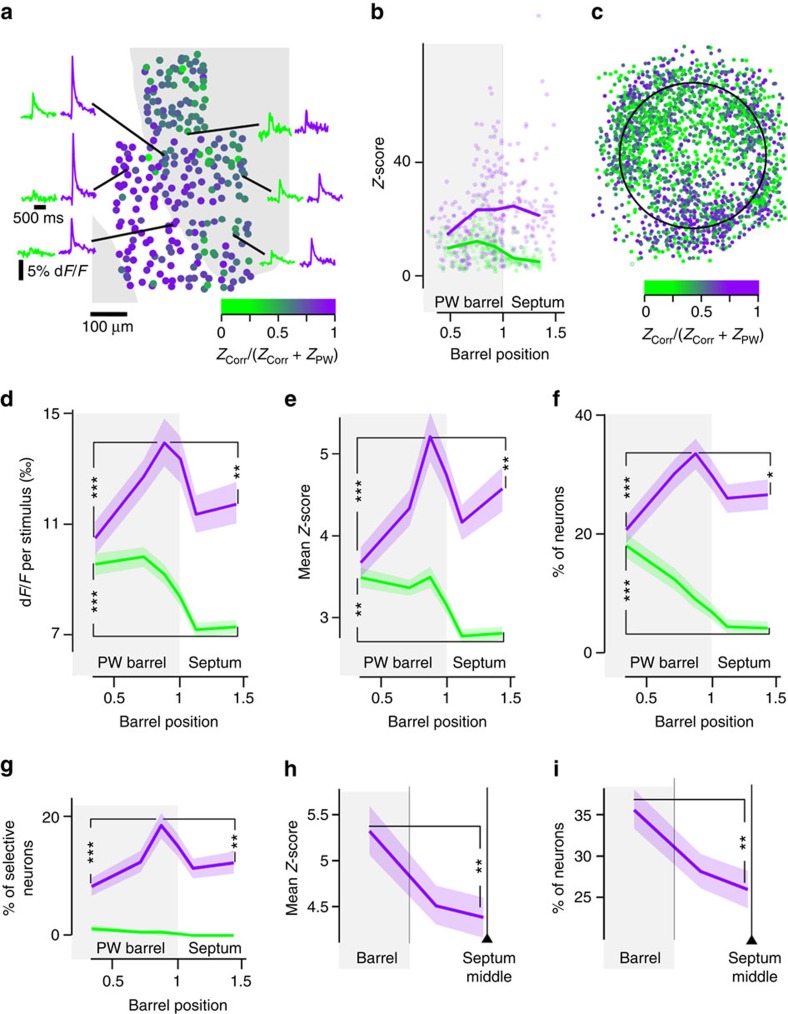
Figure 2. A radial map of responses evoked by correlated (purple) versus uncorrelated stimulations (measured on the PW, green).
(a) Z-score-derived correlated/uncorrelated stimulation preference index in an individual experiment. Marginal curves: example stimulus-triggered average calcium transients. Grey background: layer 4 barrel. White: septum. (b) Projection of Z-scores from a in normalized barrel radius coordinates. Lines: local Z-score median. (c) Projection in a normalized barrel of all recorded neurons. Colour code: Z-score-derived correlated/uncorrelated stimulation preference index. (d) Radial profile (364 neurons per bin) of mean correlated/uncorrelated stimulation-evoked dF/F, for all recorded neurons. Light background: bootstrap-derived 70% confidence interval. ***Mann–Whitney P=5.3E-4 for uncorrelated and 2.1E-6 for correlated stimulation-evoked responses. **P=2.0E-3. (e) Same as d for Z-scores. **Mann–Whitney P=2.1E-3 for uncorrelated and 3.6E-3 for correlated stimulation-evoked responses. ***Mann–Whitney P=5.0E-7. (f) Normalized radial profile (364 neurons per bin) of the proportion of neurons preferring correlated (purple) or uncorrelated (green) stimulations, among all responsive neurons. ***Fisher exact P=3.5E-9 for correlated and 1.9E-4 for uncorrelated stimulation-preferring neurons. **P=3.3E-2. (g) Same as f for significant tuning to correlated versus uncorrelated stimulations. ***Fisher exact P=6.1E-5. **P=8.2E-3 (364 neurons per bin). (h) Correlated stimulation-evoked mean Z-scores for all neurons, in normalized septal coordinate (444 neurons per bin). From left to right, equal neuron count bins contain neurons from area above barrel edge, septum edge and septum centre. **Mann–Whitney P=2.8E-3. (i) Same as h for the proportion of responsive correlation-preferring neurons over all cells. **Fisher exact P=2.2E-3 (444 neurons per bin).

