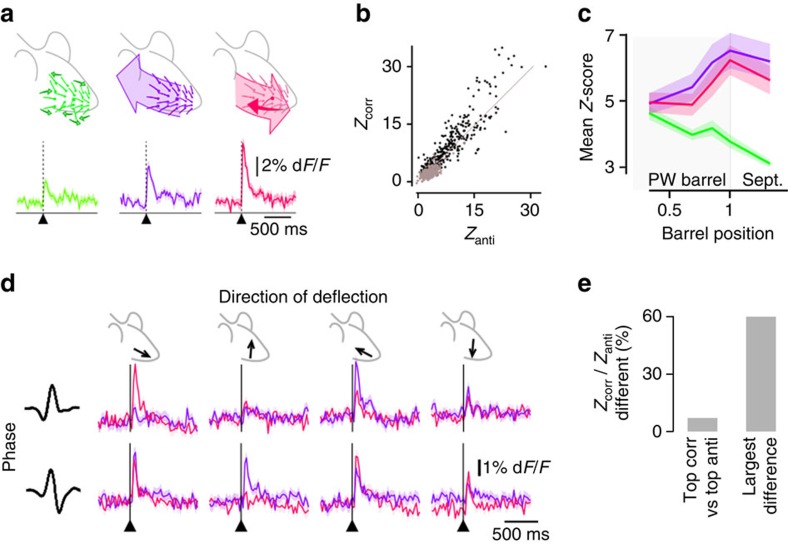
Figure 4. Comparison of the functional responses to anti-correlated stimulations with the responses to uncorrelated and correlated stimulations.
(a) Top: cartoon representation of uncorrelated (green), correlated (purple) and anti-correlated (pink) multi-whisker stimulations. Bottom: representative example of the average calcium transients triggered by each stimulation for a neuron preferring anti-correlated stimulations. Light background: bootstrap-derived 70% confidence interval of the calcium transient estimate. (b) Scatter plot of the Z-score of all neurons in response to correlated PW stimulation (Zcorr) versus anti-correlated stimulations (Zanti). Grey: neurons preferring uncorrelated over correlated stimulations. (c) Mean uncorrelated (green), correlated (purple) and anti-correlated (pink) Z-score radial distribution. Through barrel radius, correlated Z-scores are not significantly different from anti-correlated Z-scores. Light background: bootstrap-derived 70% confidence interval of the mean Z-score estimate. (d) Responses of a representative neuron to anti-correlated (pink) stimuli across two phases and four directions (rostral, caudal, dorsal and ventral) of stimulation. Same for correlated stimuli, in purple. (e) Proportion of responsive cells showing a significant difference between responses to correlated (corr) and anti-correlated stimuli, on their largest response (all phases and directions confounded, left), or at least in one condition of phase and direction out of eight (right). Sept., septum.

