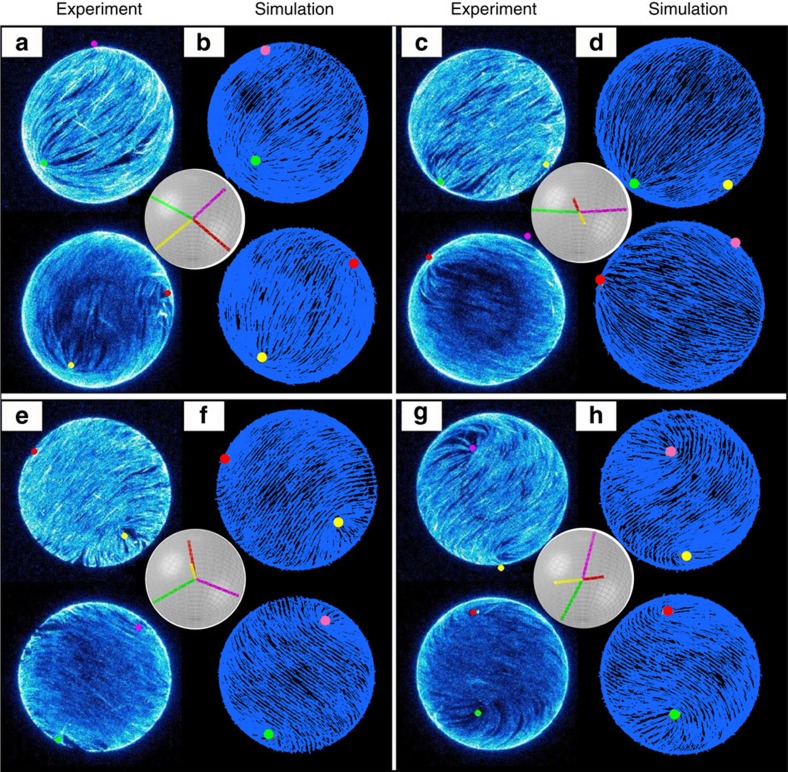
Figure 1. Representative configurations of active nematic shells at four different times.
They are labelled by a,c,e,g (experimental images from ref. 25, reprinted with permission from AAAS) and b,d,f,h (simulated structures). The two images within each labelled panel are the projections of opposite hemispheres. In all images, the coloured dots indicate the defect positions. In simulations, the blue lines correspond to the director field. The inset panels illustrate the defect configuration.

