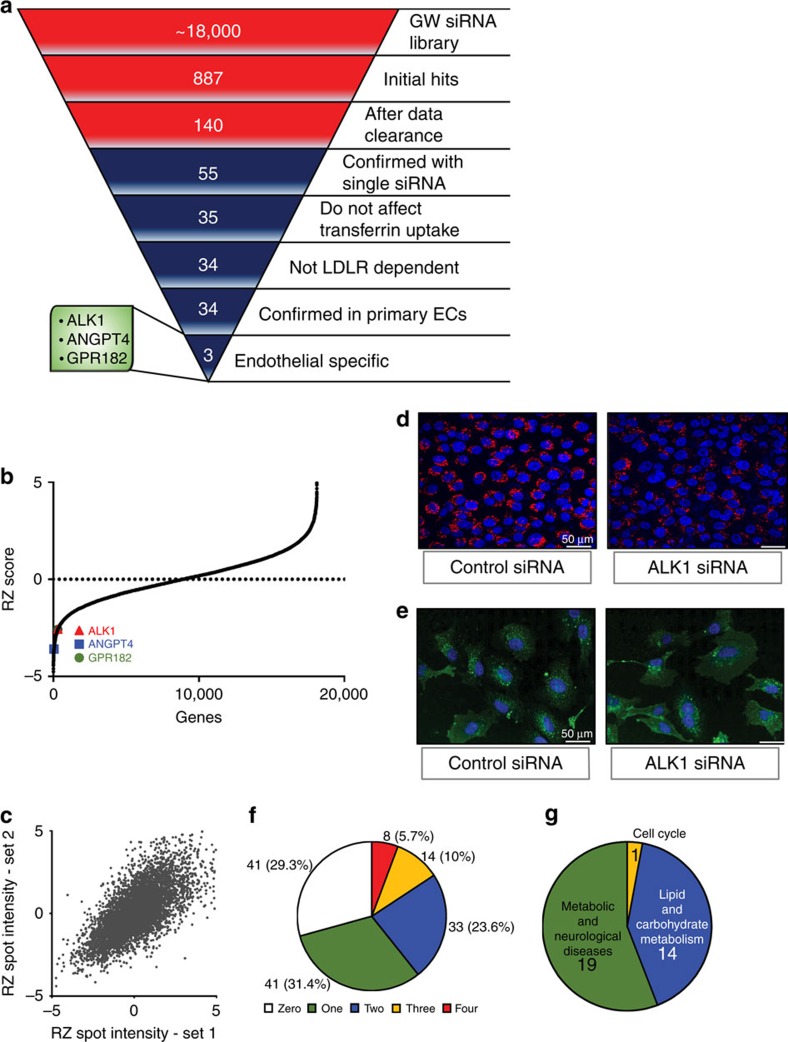
Figure 1. Screen to identify pathways regulation LDL uptake.
(a) Summary of the results from the RNAi screen. Results from genome-wide RNAi screen are red while follow-up screens are in blue. (b) Robust z-score-scores from the original screen. The inverse sigmoidal robust z-score-score distribution of genes indicates that genes can either increase or decrease DiI-LDL uptake and (c) shows the reproducibility between two individual sets of plates from the screen. (d) Representative image (scale bar, 50 μm.) of a gene knockdown of ALK1 resulting in less DiI-LDL uptake, whereas the loss of ALK1 (e) did not affect the uptake of FITC transferrin (scale bar, 50 μm). (f) Pie chart of 140 hits tested for DiI-LDL uptake inhibition in the follow-up screen, showing the number (and percentage) of active siRNAs for each hit. (g) Pathway clustering of the final 34 hits.

