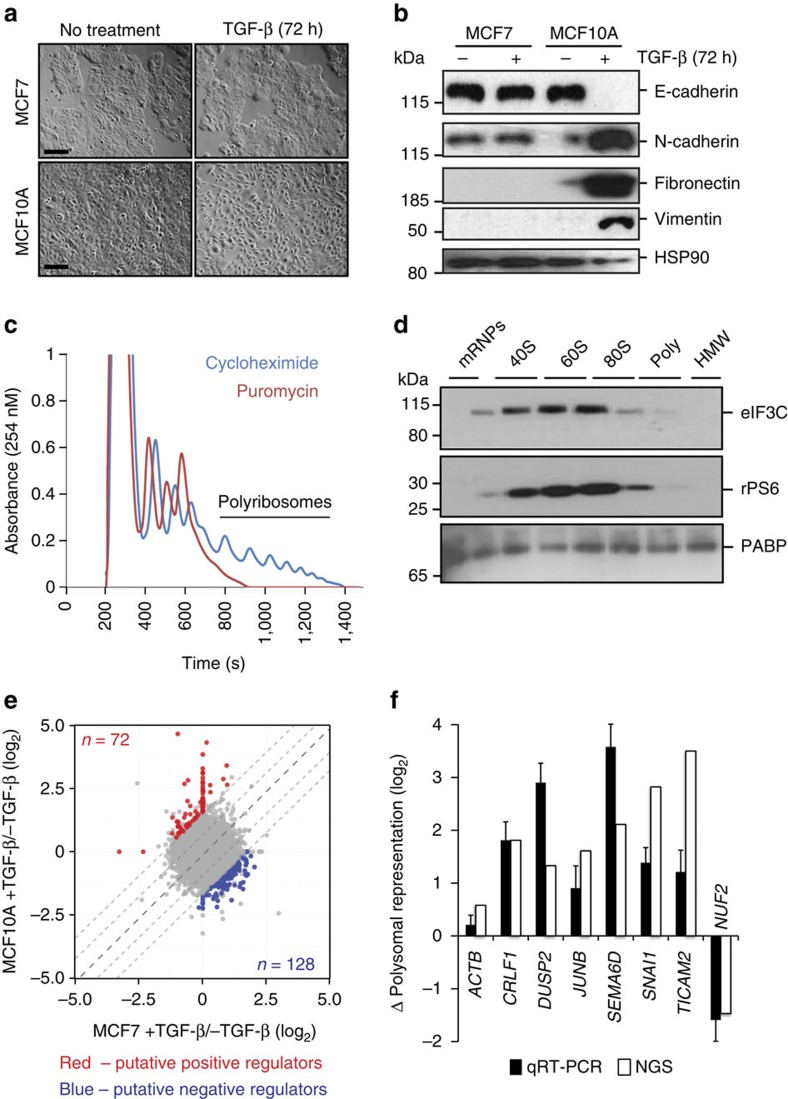
Figure 1. Polyribosomal profiling of MCF10A and MCF7 cells to identify translationally regulated genes in EMT.
(a,b) Phase-contrast micrographs (a) and immunoblot analysis of epithelial and mesenchymal markers (b) of untreated or TGF-β-treated MCF7 and MCF10A cells. Scale bar, 100 μm. Blots were stripped and re-probed for HSP90 (bottom panel) as a loading control. (c,d) Representative polyribosome isolation profile (c) and immunoblot (d) to demonstrate fidelity of fractionation. (e) Polyribosomal enrichment and depletion associated with EMT. On each axis, values derived for the indicated cell line treated with TGF-β are normalized to values derived from the same cell line in the absence of treatment. Center diagonal indicates mean of comparison, middle diagonals indicate one s.d. from the mean, outer diagonals indicate two s.d. from the mean. (f) qRT-PCR validation of polyribosomal enrichment and depletion of representative events from (e) using total and polyribosomal mRNA in untreated and TGF-β-treated MCF10A cells. All panels are representative of a minimum of three experimental replicates. For immunoblots depicted, samples were derived from the same experiment and gels were processed in parallel. Error bars depict s.e.m. See also Supplementary Fig. 1. Full scans of blots are shown in Supplementary Fig. 7. HMW, high molecular weight; NGS, next-generation sequencing.

