FIG 2.
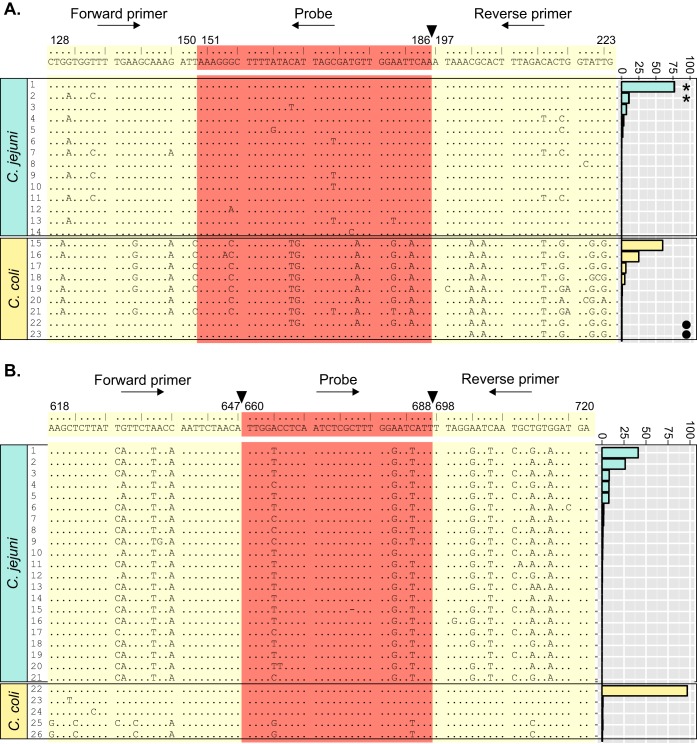
Genetic diversity of mapA (A) and ceuE (B) primer and probe sequences. Published primer (cream) and probe (orange) sequences (19) are shown above concatenated nucleotide sequence alignments of unique combinations identified in genomes from campylobacteriosis cases in Oxfordshire (2011 to 2013). Dots represent conserved nucleotides. Numbers above the published primers and probes indicate nucleotide positions relative to the complete gene, with breaks between regions marked (▼). Adjacent histograms indicate frequencies of combinations in C. jejuni (blue) and C. coli (yellow). *, complete C. jejuni-specific combination detected in a single C. coli isolate; ●, composite nonspecific combination detected in a single C. coli isolate.

