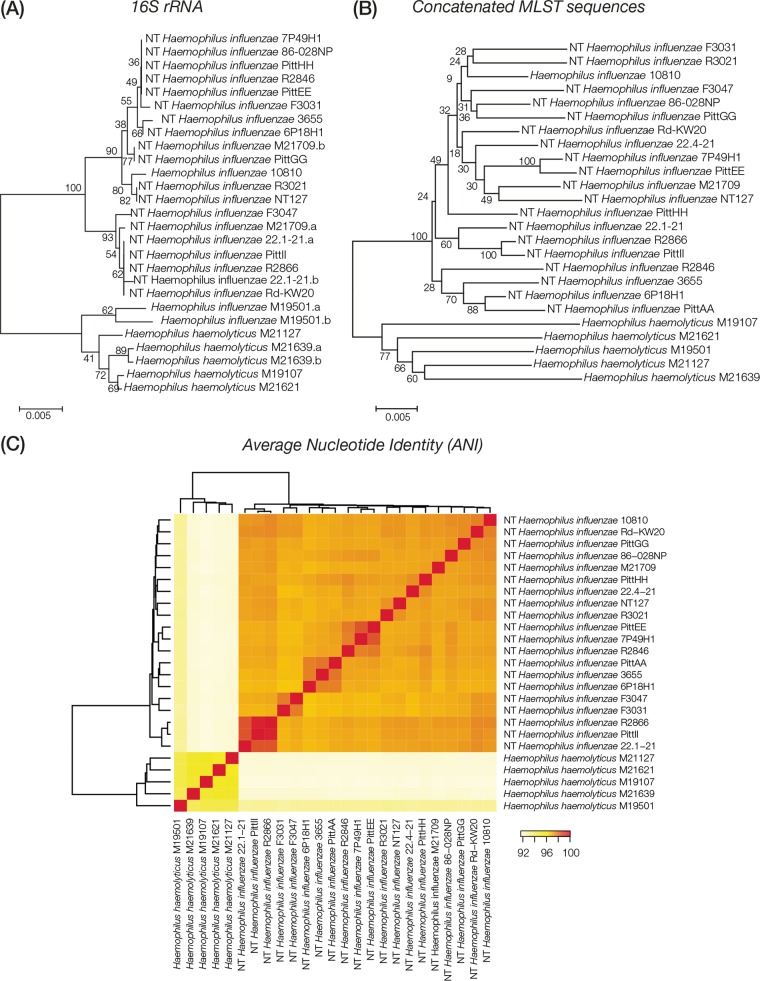
FIG 1.
Comparison of H. haemolyticus versus H. influenzae evolutionary lineages. H. haemolyticus and H. influenzae strains analyzed here are labeled with their species abbreviations and the strain names shown in Table 1. (A and B) Phylogenetic trees based on 16S rRNA gene (A) and concatenated MLST loci (B) showing the evolutionary relationships of the H. haemolyticus and H. influenzae genome sequences analyzed here. Percent bootstrap values indicate support for internal nodes on the trees, and the branch length scale bars show P distances. (C) Results of whole-genome sequence comparisons among H. haemolyticus and H. influenzae based on ANI analysis. ANI values (percentages) between pairs of genomes are color coded as shown in the key, and the relationships among the genomes based on these values are shown as dendrograms on both axes.

